




Our third Summit in Leeds
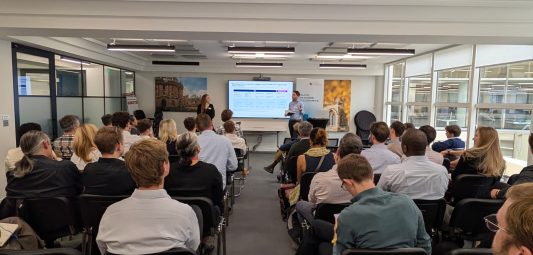
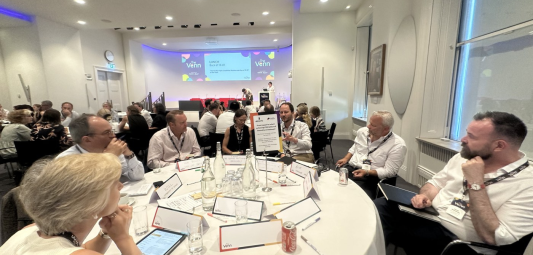
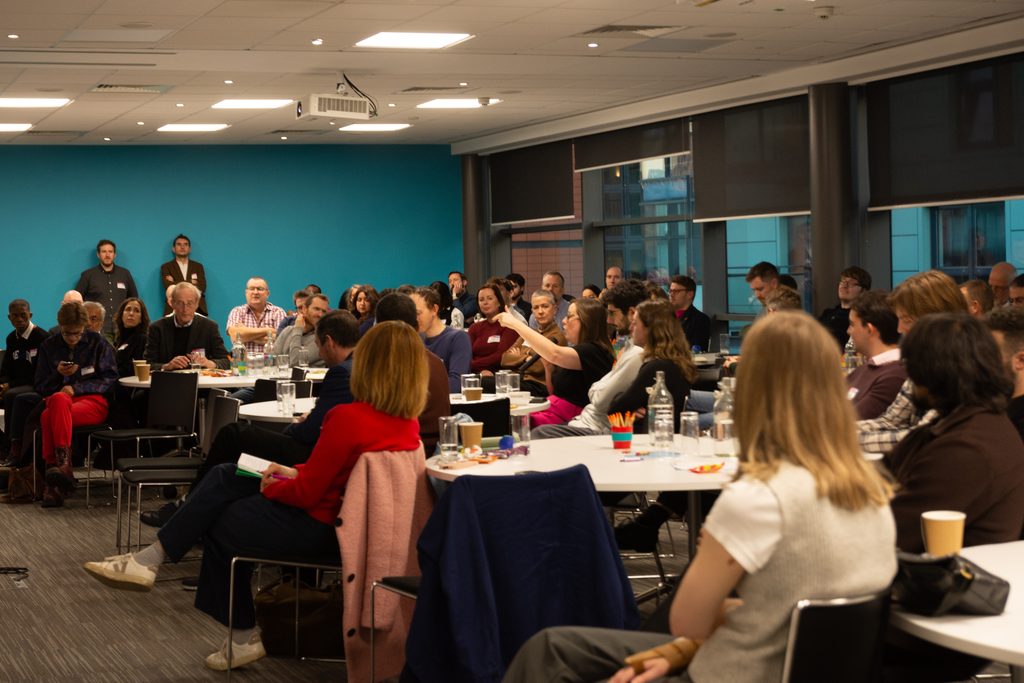
On the12th November we welcomed customers, partners and friends to Leeds for our third annual Data City Summit. One idea ran through the day: making the invisible visible. Speaker after speaker showed how company-level data reveals parts of the economy that official statistics miss, and what that means for decisions about investment, skills and place.
The first half focused on stories in data. The second half turned to the frontier, from creative industries and life sciences to forecasting and international comparisons.
Here’s a wrap up of what was said.
The day at a glance
- Official statistics miss a lot. In the creative industries, screen and life sciences, speakers showed how mapping what companies actually do reveals businesses, supply chains and value that SIC codes hide.
- The frontier matters to everyone. Frontier companies are 60% more productive than the rest of the economy, and places with more of them have more local jobs in cafés, bars and shops.
- Growth is concentrated. Half of all UK frontier jobs sit in just 100 one-kilometre areas, mostly in city centres.
- Data needs a story. Numbers change decisions when they’re framed around people and end with a clear ask.
- The Data City is going global. Industry Engine launches in Ireland within weeks, with France, Germany and the US to follow.
Vibes are great, but data is better
Ed Whiting, Chief Executive of Leeds City Council, opened the day. Around 60% of the Leeds economy is financial, business and professional services alongside data and digital, and growth in those sectors drives the city. Footfall is up, and Leeds station is busier than before the pandemic, which is unusual nationally.
His message to the room was that the sectors a place backs really matter, and those choices should rest on evidence. “Vibes are great, but data is better,” he said. Knowing who is actually here and doing business is vital to any growth strategy, and Leeds City Council uses The Data City to get closer to that picture.
Five things our data showed us this year
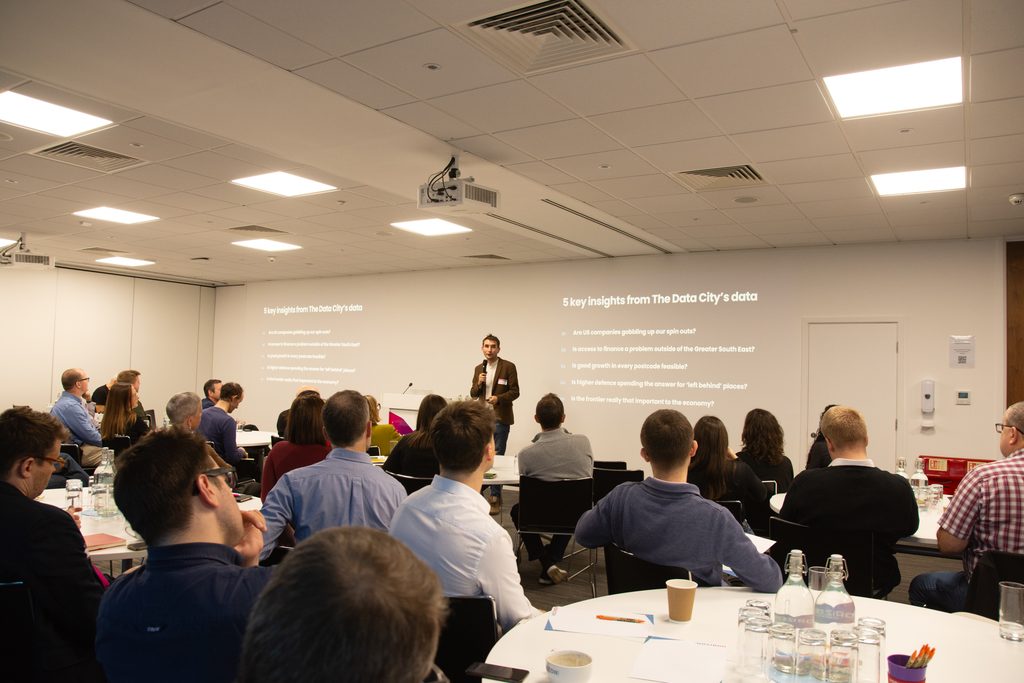
Paul Swinney, our Chief Economist, put five popular policy claims to the test using The Data City’s data on 4.5 million active UK companies.
- Are US companies snapping up UK university spinouts?
- Is access to finance a problem outside the Greater South East?
- Is good growth in every postcode feasible?
- Is defence spending the answer for left-behind places?
- Does the frontier economy matter to everyone else?
Paul also introduced our new podcast, Tales from the Cutting Edge. The first episode features Pete Daykin of Wordnerds, a North East AI company that turns customer feedback into analytics.
You’re better at data storytelling than you think
Thierry Ngutegure, founder of data storytelling agency Six Chillies, argued that what holds most people back is confidence rather than skill. He cited figures showing 51% of teams rate their ability to produce high-quality insights as poor or very poor, and only 21% of the global workforce feels fully confident with data. Yet most of us can recite our step count or last night’s sleep from a fitness tracker.
His advice was to decide what story you want to tell before you start sorting the data, and to break out of “report and repeat” mode. Every data point is a person doing something. Strip the emotion out of Little Red Riding Hood or the opening of Pixar’s Up and nobody would remember them.
Creative industries, screen, life sciences and Leeds tech
After lunch the programme turned to sectors that standard industry codes struggle to see.
Finding the hidden value of the creative economy
Iain Bennett and Jon Bains of the Fifth Sector used Southampton as a worked example. Of the 3,483 company records in their activity-led study, 2,622 carry a registered creative SIC code. That leaves 861 records that a SIC-based view would miss.
They showed how creative work crosses the usual lines. A company can blend several creative activities, share capabilities with other industries or apply them in different markets. An immersive port experience and a crane-training simulator look like very different products, yet much of the work behind them is the same. They also showed that an agency’s payroll is rarely its delivery team. Follow a project from brief to delivery and you find freelancers and outside contributors that a staff count never shows.
Mapping Britain’s convergent screen industries
Professor Emily Caston, Director of PRISM at the University of West London, asked what the West London screen cluster would look like if you classified what companies actually do. Different screen formats increasingly share studios, suppliers and people, but separate SIC codes hide those links.
Her team combined interviews with studio heads and producers, 125 years of archive research and a custom industrial classification built with The Data City. It started as a 200-company pilot, merging SIC codes, RSICs and RTICs, with every record checked by hand.
The result was 6,842 companies across nine London boroughs, with combined annual turnover of £74.5 billion and estimated growth of 3.3% a year.
The businesses behind the numbers
Gareth Healey, an immunologist turned Head of Economic Development at Life Sciences Hub Wales, explained why headline figures only go so far. Official statistics put Welsh life sciences at 290 companies, 12,335 jobs and £3.23 billion turnover in 2024/25. They can’t tell his team which business has the capability someone needs.
Working with The Data City, Life Sciences Hub Wales built a detailed sector map, combining its own sector knowledge with our classifications and then checking and refining the results together.
Making the Leeds tech sector visible to the world
Stuart Clarke and Mitali Mookerjee closed the session with a fireside chat on how Leeds can show the world the strength of its tech sector.
Forecasting the UK’s frontier sectors
Liam Sides, Director at Oxford Economics, our investment partner, showed what happens when The Data City’s classifications, local employment estimates, job postings and funding data feed into Oxford Economics’ forecasting models. The result is a forecast of the UK’s industrial strategy sectors down to individual postcodes.
Company innovation across countries
Tom Forth, our co-founder and CTO, took the room around the world starting from a single company. Kraken, the technology business that grew out of Octopus Energy, is classed under SIC as business and domestic software development. Our RTICs show it works in net zero infrastructure, smart grids and AI for green technology.
Then came the grid. On a still night in Leeds with strong wind in northern Scotland, around 5 gigawatts of wind power was switched off because the network couldn’t carry it south. Cable Coatings Limited in Batley, a University of Manchester spinout growing 35% a year, uses robots to coat power lines so they stay cool and carry about 10% more power. Its SIC code is other manufacturing not elsewhere classified. One of its investors is Extantia, a Berlin climate fund whose German classification simply says activities of head offices.
From Batley, Tom followed similar companies to Prysmian in Milan and its US business in Kentucky, then to a French company using drones on energy grids, the Bordeaux firm that builds those drones, and finally to a drone specialist directly across the road from the venue in Leeds. The Data City now covers five countries, with 65 RTICs and 505 verticals, and makes companies comparable across five different national classification systems.
Asked what government should do about SIC, Tom said official classifications won’t keep up with the pace of change AI is bringing. His suggestion was a real-time system shared across government, where a company can sit in several sectors and users can create new ones when they spot a gap.
What’s next for The Data City
Alex Craven, our CEO, closed with an update on the business. The Data City started in 2017, raised £2 million with Oxford Economics in 2025 and opened a New York office in September. We’re growing at around 60% a year.
Three new products are in development. The University Engine shows how universities work with businesses through spinouts, knowledge transfer partnerships and graduate flows, with work under way alongside the universities of York, East London and Manchester and early talks with Universities UK. The Growth Engine lets customers upload their own client lists to see their market share by sector and how much more there is to win.
The Growth Finder (working title), being developed with EPSRC and UKRI, flags companies that are growing, innovating or disrupting a traditional sector. The disruptor flag compares how a company describes itself with its industry peers. Alex’s example was a cloud software company built for the poultry and egg industry, a software firm sitting where software firms rarely appear.
Looking to 2027, the Industry Engine launches in Ireland within weeks, with France, Germany and the US to follow, and the long-term ambition is to cover the G20.
Thank you
Thank you to every speaker, to Leeds City Council and to everyone who joined us on the day. If a talk sparked a question about your own sector or place, get in touch and we’ll show you the data behind it. See you next year for the next chapter.