Version 4.5 of The Data City brings big improvements in how we estimate company size and growth rates.
We have developed our own methods for estimating company growth rates even when only limited data is available, for example where employee counts are reported infrequently or have not been reported recently.
We can also now estimate turnovers and turnover growth rates for companies that do not report turnover. We do this by assuming that similar companies have similar turnover to employee ratios.
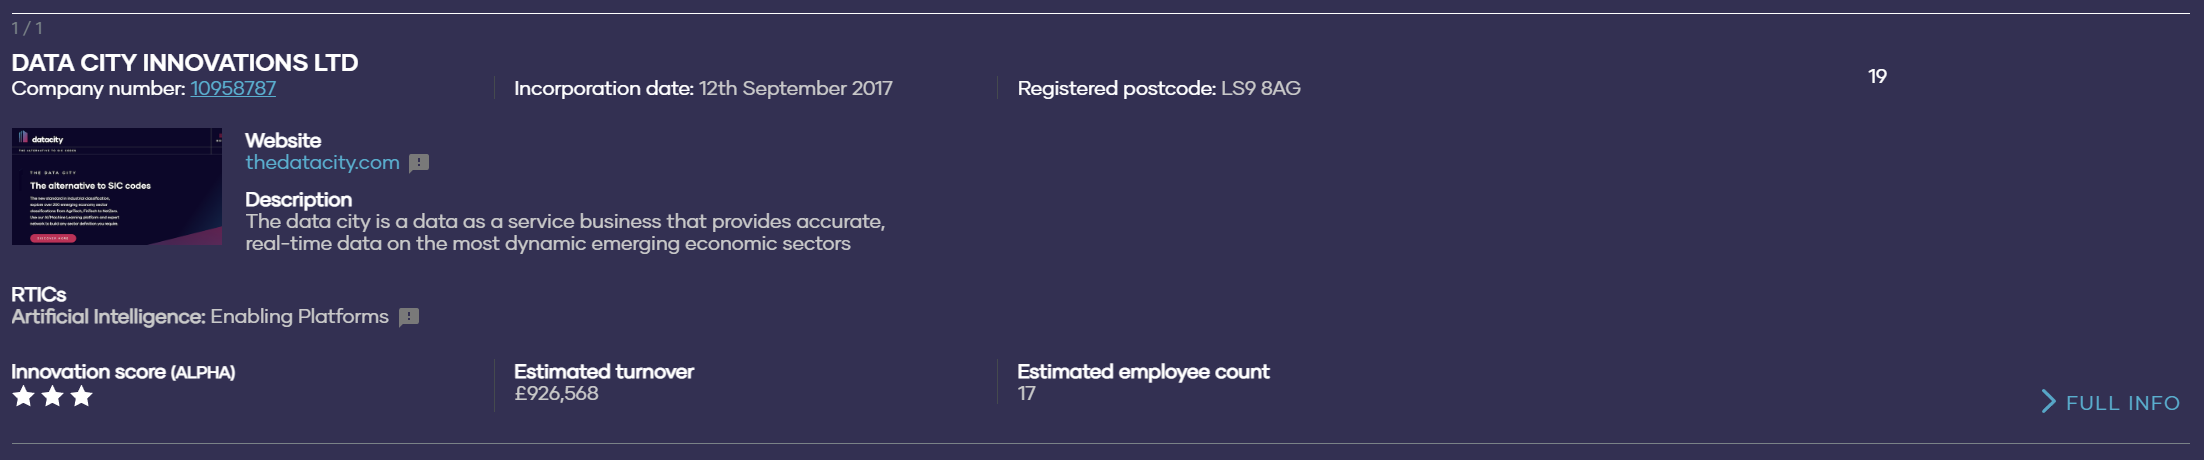
You will see our best estimates for current Turnover and Employee count in the company summaries for 2.4 million businesses. Those businesses without an estimate are very likely to have zero employees. You can expect these estimates to change every quarter as our estimates of company size are no longer constrained by annual accounting releases.
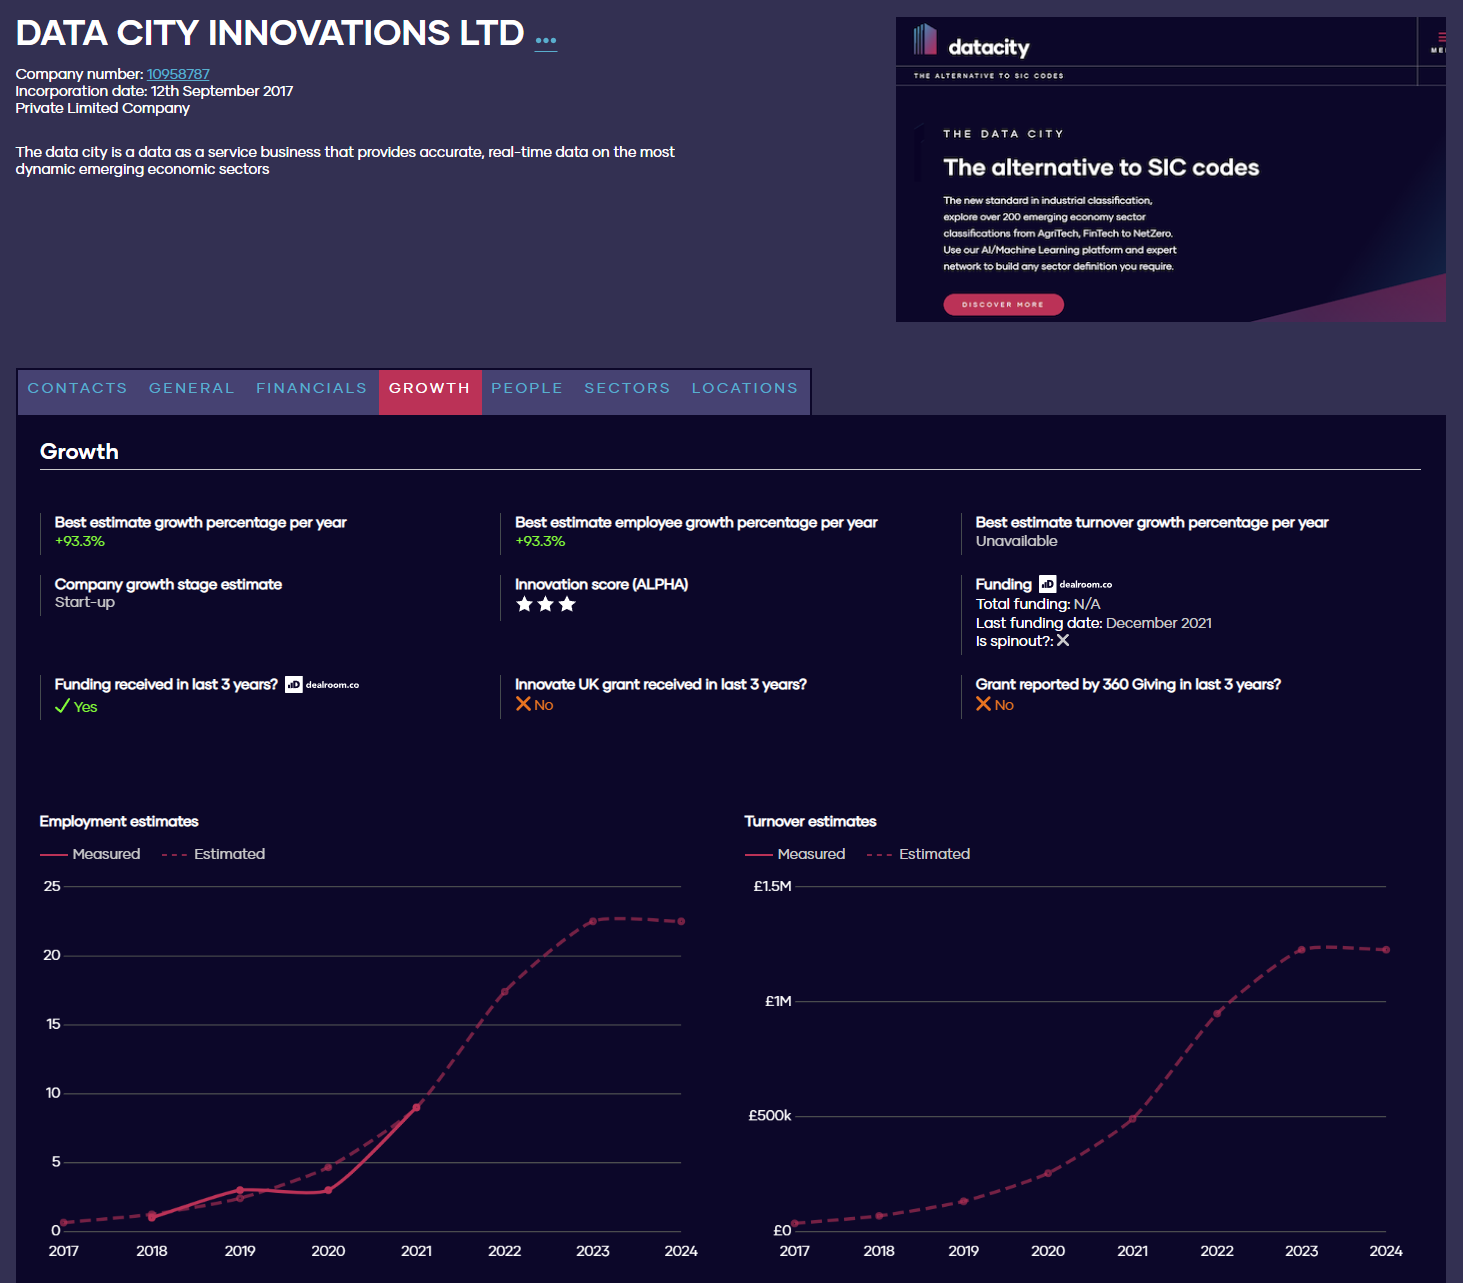
Growth in our UI
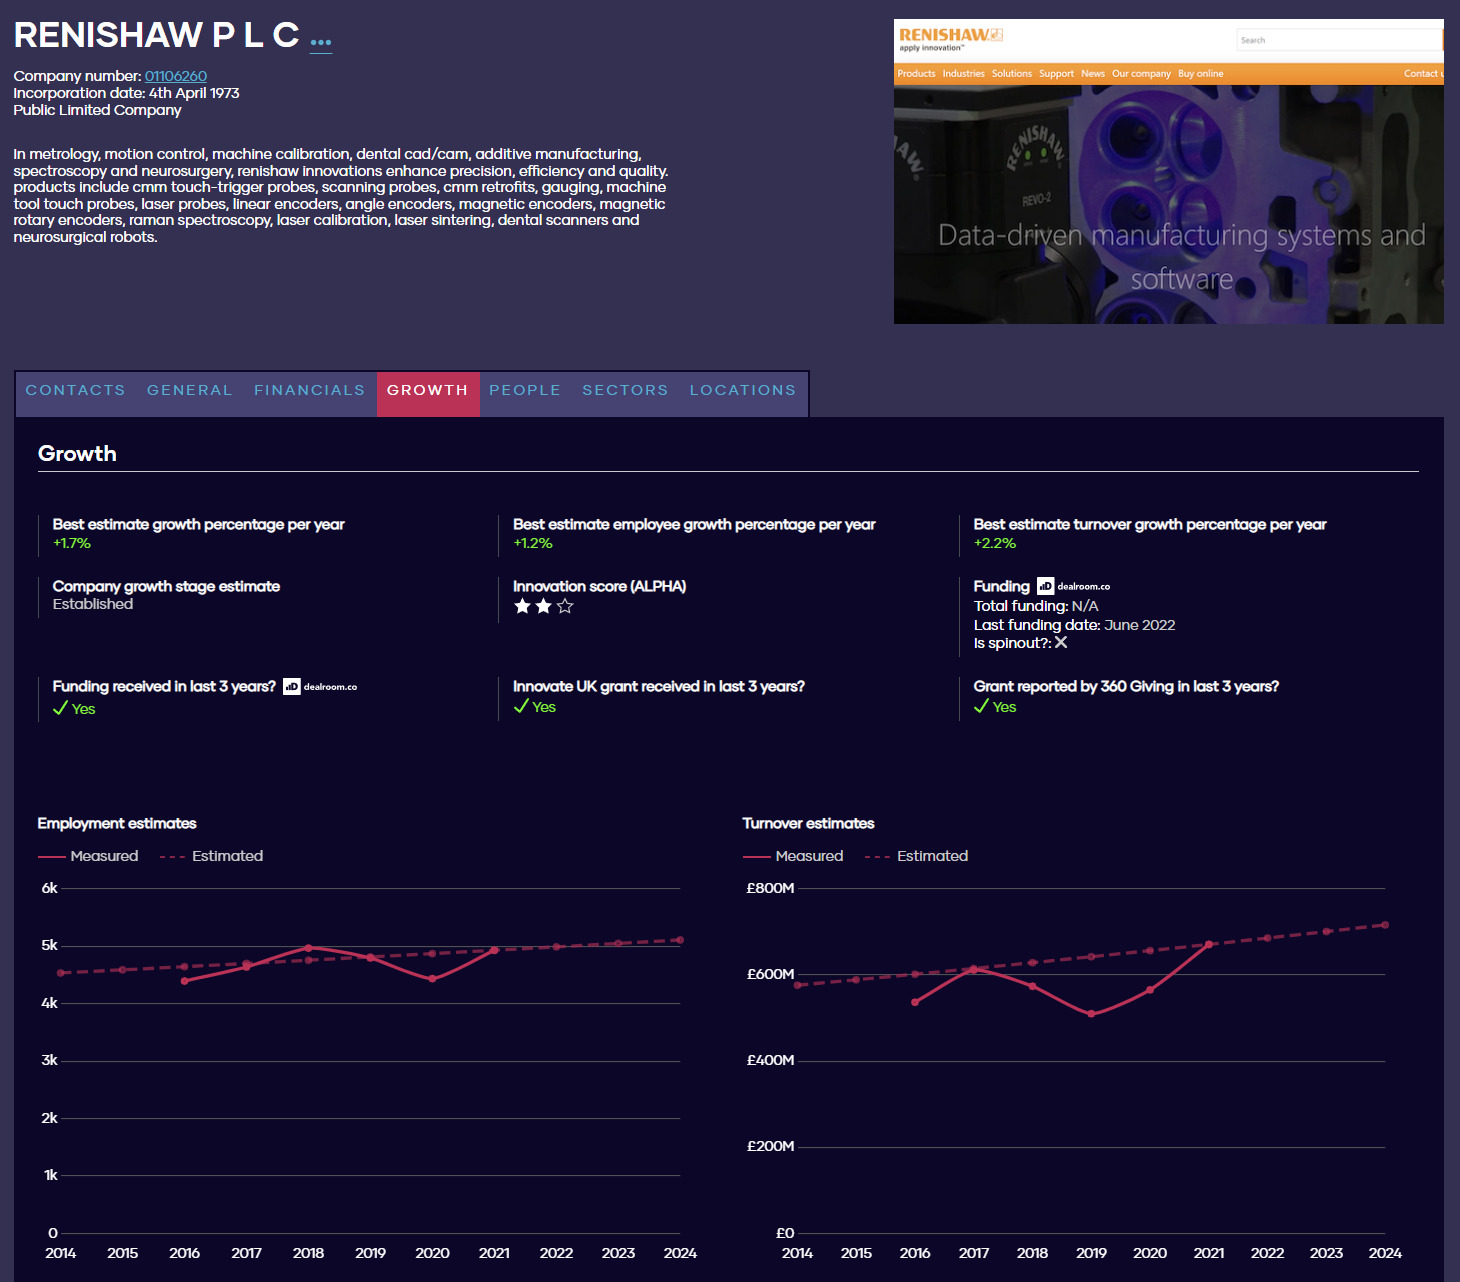
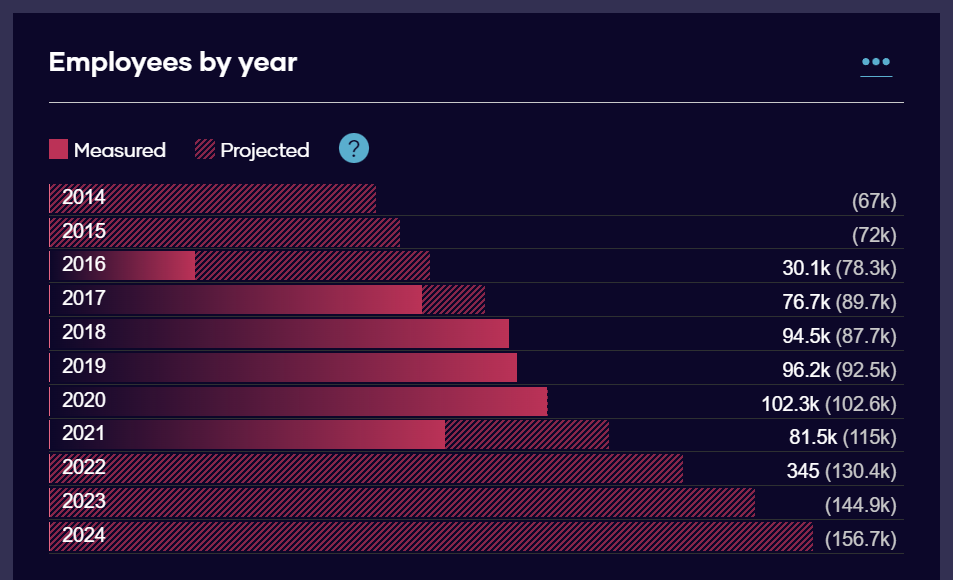
To make this richer data easier to access, we have redesigned our detailed company view. The new Growth tab shows our estimates of company employees and turnover by year.
The best way for you to get a feel for our estimation algorithm is to look at the graphs in this growth tabs for a few companies that you know well.
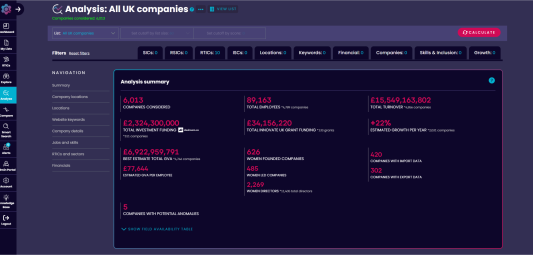
Improvements to Analyse
Our improved estimates of company employee count, turnover, and growth rates lead to large improvements throughout our product. For example, in Analyse the estimated annual growth rate of a list is more accurate and extends from 2014 to 2024.
With better data comes new features.
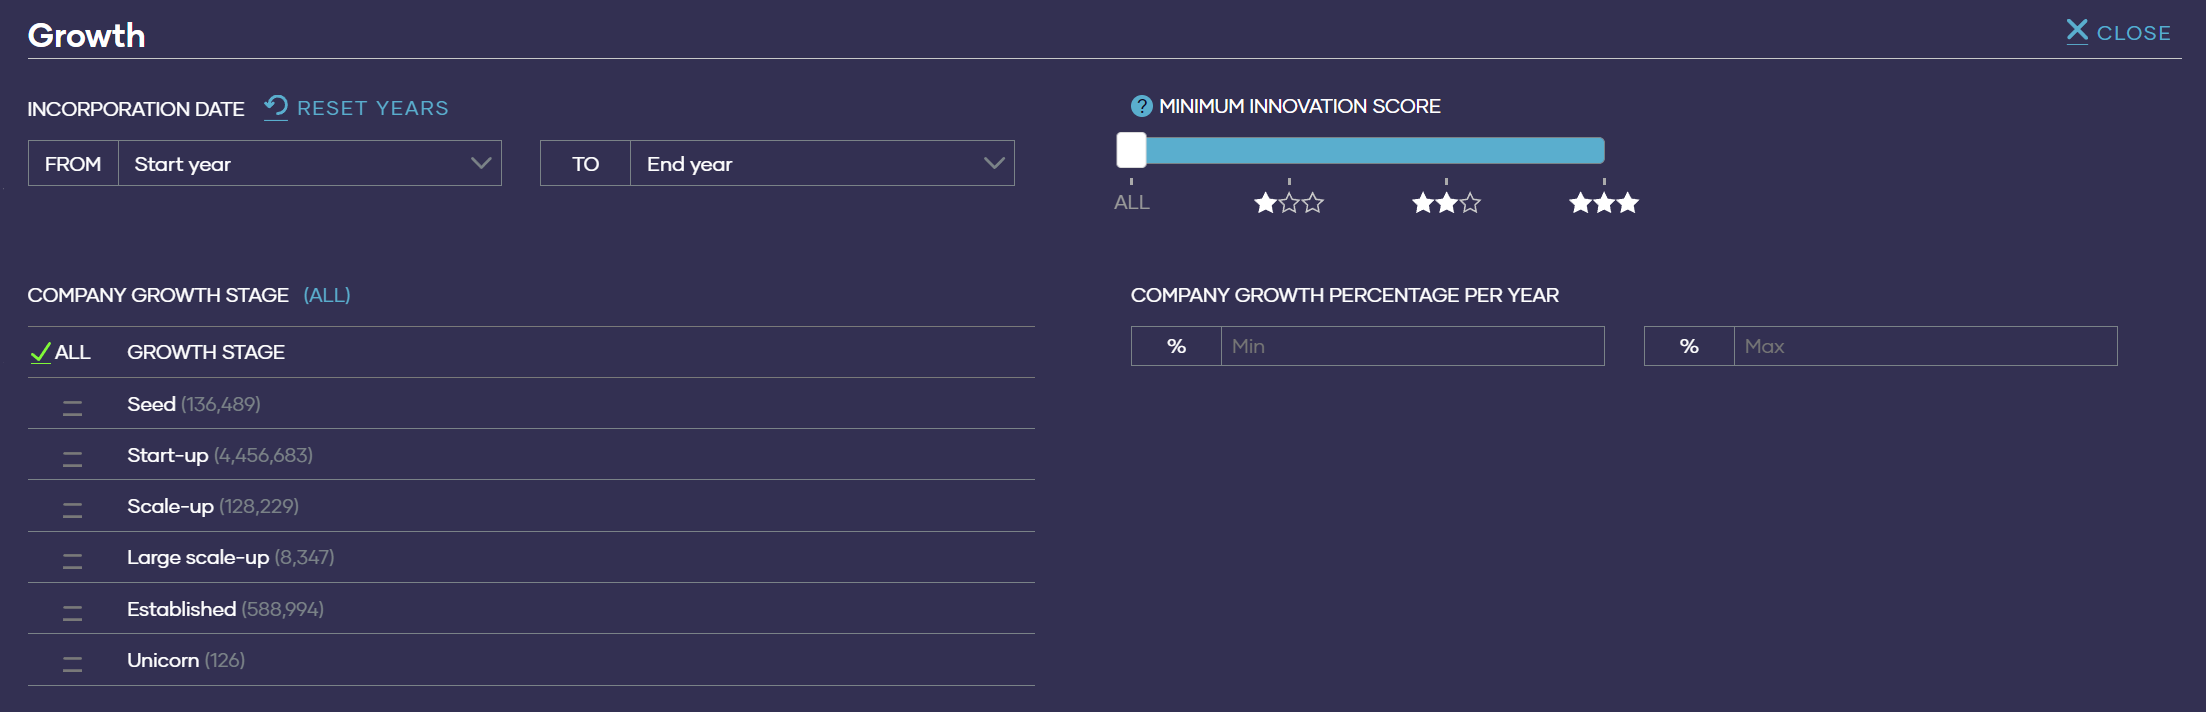
For the first time we are able to offer a filter for company growth rate in addition to our sort by growth rate feature in every list. Finding fast growing or struggling companies in your lists should be much quicker and easier.
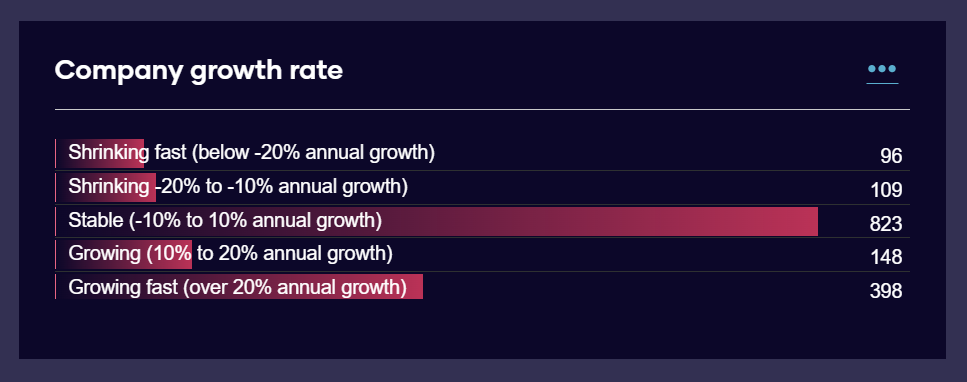
And for every list in Analyse you’ll now see a breakdown of growth rates to get a feel of how well companies within a sector are doing beyond the headline numbers for that sector.
We have been testing our new features for a few months internally. With the April update we feel confident to release them, but of course there may still be bugs, and some strange growth projections for some companies.
What’s next?
We are already working on two improvements.
First, we know that we can do better at communicating years. That company accounts frequently report an employee count from March 2023 for the financial year starting in April 6th 2022 is hard to work with. For fast-growing companies especially being a year out in our employee estimates can make a big difference.
Second, we don’t consider inflation in our product. This has not been a major issue to date since UK inflation at below 2% has been of limited importance to most analysis. With inflation currently at 10% this is no longer the case and we are reviewing our full data preparation pipeline and our data presentation to take this into account. If you are interested in real growth of sectors rather than nominal growth you will need to take this into account in your analysis.
We’d love to hear from you about our new growth rates data. Our users, customers, and partners have always been and continue to be our most valuable source of feedback, feature requests, and bug fixes.
Interested in seeing our growth features first-hand? Join us on the 25th May for our third Emerging Economy Open Forum webinar. Register for free today.