So instead of classifying companies by the SIC code that the company chose when it registered, we classify companies by what they say they do on the web. Then we add data on how many people a company employs, where it operates, what its turnover is, and much more, including up to six years of historical financial information. Then we help you to explore, analyse, and map those companies, their finances, and their activities using our unique tools.
Our methods are innovative. They are increasingly proven in peer-reviewed papers, in use by national statistics agencies, and by our customers. They are improving rapidly. The answers to the questions that you have today will be great. In a year they will be even better.
Our data is imperfect. We provide rigorous estimates of our accuracy. We are almost always better than the alternatives and we will tell you when we might not be.
Our methods for getting the best out of our product and proving its accuracy and power are shared in this document. They are accompanied by our plans to improve by understanding how you use our product and by listening to your suggestions.
Thank you for choosing us, our team, and our data. Every customer and every piece of feedback we receive helps us to be even better.
The Data City’s database.
Our database is updated at least quarterly. Extra refreshes are available on request.
In summary, it contains,
- 5.1 million active companies (every active company in Companies House)
- of which 3.3 million have financial assets data for at least one of the past six years.
- of which 2.1 million have employee count estimates for at least one of the past six years.
- of which 2.1 million have turnover estimates for at least one of the past six years.
- of which 2.1 million have employee count estimates for at least one of the past six years.
- of which 1.6 million have at least one matched website (with 92% accuracy).
- giving 12 million unique web pages, with 32GB of instantly searchable web text.
- with 4.1 million registered addresses.
- plus an additional 0.9 million trading addresses found only through web scraping.
- of which 3.3 million have financial assets data for at least one of the past six years.
Company financials.
We have partnered with CreditSafe to provide company financials for 3.3 million companies in our database. This gives us more coverage and higher quality data than the digital company accounts available from Companies House.
Website content.
1 million of the companies in our database have a matched homepage. Where additional pages are linked to from that homepage (especially pages such as “About us”, “Contact us”, “Products”, “Services”, etc…) we download their contents too, up to a maximum of 75 pages.
Our database of 12 million unique websites containing 32GB of text linked to 1 million companies is the largest of its kind. Full text search of this database is instant.
Most companies in the UK are so small that they do not have websites. Our most conservative estimate of 70% successful website matching for companies uses the 1.4 million business in the UK that employ people as the denominator. But we do much better than this.
Our company to website matching methods work better for larger companies since they are more likely to have detailed websites. Of the UK’s 250 thousand businesses employing more than ten people, our database covers 200 thousand (80%).
In real world tests, we do even better. Working with our users we measure coverage of over 90%, as detailed in the quality assurance section of this document.
User reports of missing URLs make our website matching quality and coverage better all the time.
Operating address estimation.
Companies registered in the UK provide a maximum of one address to companies house. There is no requirement that this represents a true location of operation. A single office in London used by a company registration service is the registered address of over 37 thousand companies and there are many similar examples.
We search the contents of company websites to estimate the true operating location of companies. This works particularly well for the largest companies. For example, we identify all nine operating locations of ARM Holdings Ltd because they are listed on the global offices page of their website.
A total of 0.9 million additional operating addresses are assigned to companies in this way, with additions being concentrated in cities and in large companies. In rural areas, operating address estimation increases company counts by around 10%. In urban areas, operating address estimation increases company counts by closer to 35%.
Searchable details for every company in the UK.
Our database contains details on every registered company in the UK and a dedicated page for each company telling you more about it.

Basic techniques for using of The Data City platform.
Explore UI.
Exploring our data is easy. You start with a list of every company in the UK and filter by SIC code, local authority, turnover, or any of dozens more properties.
For example, you can find the companies operating in North East England with fewer than 250 employees and SIC code 17120 (Manufacture of paper and paperboard) in a few seconds. Currently there are three.
You can enter part of a company name or its company number to see its details. Or enter a list of company numbers to see details for all of them.
Keyword searching.
The Data City lets you find every company with any word or phrase on their website.
Search for “cyber” and you’ll get a list of companies that mention “cyber” on their website. Add a location filter and an employee count filter and your list could be of every company in Leeds with between 50 and 250 employees that mention cyber on their website. Currently there are 207.
Search for “cyber security” instead and there are 83 companies.
Keyword searching is a powerful tool, but it has its limits. Just because a company mentions cyber security on its website doesn’t meant that they work in the field.
They may be recruiters trying to place people in cyber security roles. They may have an online shop that celebrates that they take cyber security seriously. And there are many more ways in which keyword searching can fall short when trying to find companies that operate in a sector.
Machine learning fixes most of these problems.
Building lists using machine learning.
Lists based on machine-learning start with some example companies. Pick at least three companies that you think should be in your list and our machine-learning learning process will rank the 1 million companies in our database by how similar they are to them. The process used to take about ten minutes, but only takes around 10 seconds.
The first results are always bad, but the process is iterative. Selecting a few examples companies that you don’t want in your list to exclude from the training set that you’re building and rebuilding the list will improve things enormously.
After a few more rounds of refining the training set in this way you will have a good list, usually hundreds to thousands of companies that do the same thing as the three companies you started with.
Lists built this way can be explored and analysed using the same filters as in the Explore UI.
Excel and CSV downloads.
All lists can be downloaded in Excel or CSV format for further analysis. Structured data can be provided in other formats including PowerBI on request.
Advanced techniques for using of The Data City platform.
Advanced keyword search.
Keyword searching within The Data City platform has several advanced features.
- Wildcard search. For example “synthetic genom”* will matchsynthetic genomes, synthetic genome, synthetic genomics, etc…
- Near search. For example NEAR(“graphene” “battery”, 10) will match any instance of the words graphene and battery within 10 words, in either direction.
- Combined searches using brackets and the AND and OR keywords.
For example, the following search returns a list of companies whose website contains all of the words synthetic, cluster, andgene* (where gene* will match gene, genetic, genetics, etc…)
"synthetic" AND "gene"* AND "cluster"
We can combine multiple searches in this way. For example, the following search returns all of the companies from the previous search plus any companies whose website contains the phrase synthetic promoter.
"synthetic promoter" OR ("synthetic" AND "gene"* AND "cluster")
In the most advanced applications of this technology complex keyword searches can be developed such as.
("synthetic biolog"* OR "synthetic dna" OR "synthetic genom"* OR "synthetic nucleotide"* OR "synthetic promoter" OR ("synthetic" AND "gene"* AND "cluster") OR "genomics") AND ("chemical"* OR "flavor" OR "flavour" OR "dye" OR "paint" OR "composite"* OR "vitamin"* OR "cosmetic"* OR "polymer" OR "plastic" OR “fragrance” OR "aroma")
This keyword search returns 5520 companies in the UK most of which work with synthetic biology to provide feed materials for perfumery, dye, and cosmetics industries.

Advanced list building using machine-learning: taxonomies, supply chains, supply chain segments.
SIC codes are good at identifying companies that operate in a long-established sector of the economy, for example brewing beer.
Simple ML lists are good at identifying groups of companies that do similar things even if there is no SIC code for that. For example, brewing craft beer, running bars that sell craft beer, or running companies that export craft beer.
Advanced list building lets us combine multiple lists and work with them together.
For example, we may want to look at the whole craft beer supply chain. This supply chain will at least include growing speciality ingredients, manufacturing speciality equipment, brewing craft beer, and selling craft beer.
The supply chain is Craft Beer.
Each of these supply chain segments has a name, a summary, at least one indicative company, and a set of indicative keywords.
Each supply chain segment is defined by an ML list created using a training set of included companies (companies in the supply chain segment) and excluded companies (companies not in the supply chain segment). Indicative keywords can be useful to find companies to add to these training sets, but they are not in themselves used to define which companies are in the supply chain segment.

Companies can be in more than one supply chain segment, for example BrewDog are both Craft Beer: Brewers and Craft Beer: Sales.
Expertise and RTIC codes: Real-time industry classification codes.
Someone with limited sector knowledge can use The Data City platform to create a good list of companies operating in that sector. Someone with expertise of a sector can use The Data City platform to create an excellent list of companies.
Experts improve The Data City process in four main ways,
- Experts know the companies that should be included in the training set at the start of the process.
- Experts can assess whether a company they do not know should be included or excluded from the training set quickly just by looking at the company’s website.
- Experts can create a draft taxonomy structure quickly, and then refine it during list creation.
- Experts can judge the quality and coverage of the final list and say when list creation is complete.
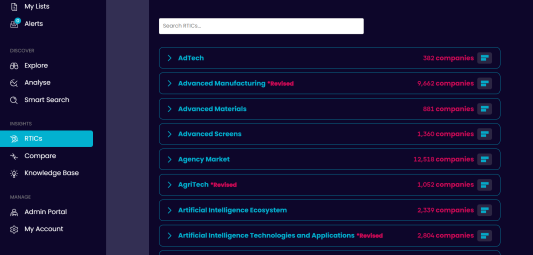
Once a sector has had its taxonomy defined, with the supply chain segments named and summarised, and an ML list built for each, it is verified by an expert. If the work and the quality of the resulting list is approved, the list becomes an RTIC and is available in our EXPLORE UI and our ANALYSE UI.

Analyse.
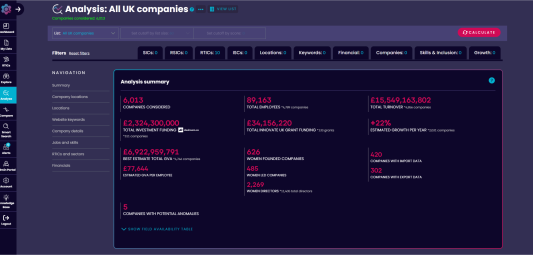
Whether using ML, keyword searches, filters by location, financial results, or more, The Data City platform is designed to provide lists of companies. The EXPLORE UI helps you to examine what each company in a list does in detail. The ANALYSE UI summarises, maps, and graphs those lists of companies.
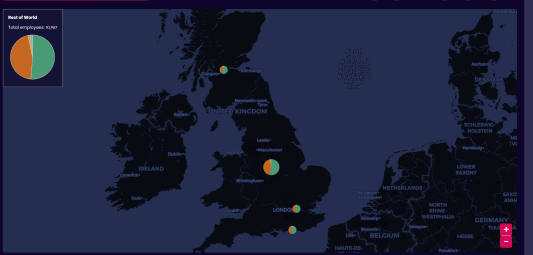
So with just a few clicks, you can visualise the distribution of employees working for companies in the UK’s distilling industry.

And alongside that graph and map are dozens more.
A list of the most valuable companies, the graph of employment growth in the sector since 2014, the distribution of company sizes by employee count, are just a few examples.
The Data City’s analyse tool can replace days of work in Excel and produce publication-ready graphics. In some cases, they offer instant analysis that is impossible anywhere else. One example is keyword enrichment analysis.
With this tool we instantly see that companies operating in the UK’s distilling industry mention being family-owned and exporters significantly more on their website than the UK average.

Keyword enrichment works for any list. So it is just one click to calculate the keyword enrichment of companies operating in Cornwall.

Using the results of analysis in reports.
The graphs, maps, and tables in the ANALYSE UI can be screenshotted and used in reports. For the highest resolution images, we recommend printing the page as a PDF and using Acrobat Reader’s high resolution screenshot function.
For the most customisable graphics, just click download on any of the widgets in the ANALYSE UI and use the data however you please.
Quality Assurance
No classification system for companies is perfect.
For example, the existing SIC code system has only a single code for over 4 million of the 4.6 million UK registered companies. This leaves most of the activities of most companies uncoded.
In addition, many SIC codes are incorrect. This is obvious in the case of citrus fruit growers in the UK, with most of the 36 UK companies given that SIC code having received it in error. It is less easy to prove elsewhere.
Lists created using machine-learning in The Data City are not perfect either. Quantifying their omissions and accuracy is difficult because there is no gold-standard to compare with. No expert would claim to have an error-free and complete list of companies operating in, for example, the craft beer sector or the artificial intelligence sector. No two experts would set the boundaries of either sector in the same place. So how can we judge the quality of our lists?
We have worked for years improving our answer to this question. Today we can confidently say that for our data is almost always better than the alternatives, and that is improving all the time. This section explains how we know that, how we continually improve our data, and how you can help us.
In this section The Data City v1.7 refers to the version of our platform that was active until The Data City v2.0 was released in May 2021.
Website matching accuracy and coverage.
We find websites for the 4.6 million active UK companies using both manual and algorithmic methods.
Our approaches can fail in two ways.
- Sometimes we do not find a website for a company that has one
- Sometimes we assign a website to a company incorrectly.
This is how we estimate the rate of both errors.
Benchmarking example 1: AI sector.
In 2020 we worked with an Oxford based research agency and a UK government funded innovation centre to identify UK companies operating within the artificial intelligence (AI) sector.
We started with a list of 99 companies and associated websites that an expert in the field had identified over many years. Our first job was to test the quality of this list.
Of the 99 expert-identified websites,
- 95 loaded and were correct.
- 3 did not load and no correct website could be found.
- 1 redirected to another website, the company having been acquired.
- We looked up these 95 companies in The Data City v1.7 platform.
- For 81 companies (85%) The Data City platform returned the same website as on the expert’s list.
- For 14 companies The Data City platform returned an incorrect website.
In February 2021 we repeated the above analysis using an early build of The Data City v2.0.
Two of the 14 companies with incorrect websites had since dissolved. Of the remaining 12,
- 6 had correct websites in The Data City v2.0.
- 6 were still incorrect. (they are correct in our live product thanks to manual correction).
Benchmarking example 2: Quantum sector.
In our most recent benchmarking project, we started with a list of 203 companies compiled by a group of experts and considered by them to represent all UK companies operating in the quantum sector.
Of the 203 companies in the list, 203 had informal company names, 200 had associated websites, and 130 had formal company names as registered with Companies House.
Of the 203 companies with associated websites in the expert list, 180 websites were found to be correct and functional.
The Data City v1.7 platform had correct websites for 163 of these 203 companies and no incorrect URL matches.
The Data City v2.0 platform has correct websites for 174 of these 203 companies and no incorrect URL matches.
Summary: Website matching quality.
In lists of companies and websites curated by experts we have found that a company will have accurate website details between 90% and 95% of the time. Even expert lists have flaws.
At the start of 2020 with The Data City v1.7 our equivalent figure was between 80% and 85%.
At the start of 2021 with The Data City v2.0 our equivalent figure is between 85% and 90%.
With manual intervention our system already outperforms experts on website matching accuracy and coverage. We expect it to match experts even before manual intervention by the start of 2022.
You can improve the quality of our database even faster by submitting mismatched URLs using the button next to every URL you see in our product.
Sector definition quality.
Even if website matching was 100% accurate with 100% coverage, a list created using The Data City platform to define a sector of the economy would not be perfect. Classification errors occur on top of website matching errors.
It is hard to measure how well our methods perform since there are no gold-standard and undisputed lists to compare the results to. Experts disagree among themselves, and with themselves over time. No experts claim that any of their lists of companies fully cover the sector.
All of this makes benchmarking our lists difficult, but it is possible.
Benchmarking example 3: Quantum sector.
Continuing from benchmarking example 2, we worked with the sector experts in quantum to create a version of their list within The Data City platform.
We used the methods described in the advanced list building using machine-learning section of this document. The 203 companies in the experts’ list were split into supply chain segments of the quantum sector defined by a taxonomy and a sample was used to define machine-learning classifiers. Companies were added to the include and exclude part of the training set in collaboration with experts.
After completing The Data City’s advanced list building process, 662 companies in the quantum sector had been found, with at least one expert approving the inclusion of each one.
Of these 662 companies, 127 were in the original list of 203 companies compiled by sector experts.
Across our list and the original list there are 703 unique companies. Of these, The Data City’s method found 94%. The experts’ original list contained 26%.

By combining the strengths of machine-learning and expertise, The Data City process for defining sectors is better than either would be independently.
Accommodating disagreement within The Data City platform.
In this example, ESP Central Limited (07087855, espcentral.co.uk) is a company that is included in the expert quantum list, but not in The Data City’s.
They are a knowledge transfer company, specialising in the promotion and commercialisation of university research. They are included in the expert’s list largely because of their involvement with the UK’s Electronics, Sensors, Photonic Knowledge Transfer Network.
There was disagreement among the experts working on the project whether ESP Central should be included in their list. The company’s specialism is in knowledge transfer across a wide range of sectors and they have little specialism in Quantum technologies themselves. It is not surprising that The Data City’s classification process also struggles to decide whether ESP Central is in the quantum sector or not.
A strength of The Data City process is that ESP Central could be added to the training set defining the Quantum sector in a few minutes. Fifteen minutes later, having examined all companies in the UK, the Quantum list would be changed to include not only ESP Central, but other similar companies operating in the knowledge transfer sector with some experience in Quantum.
In many ways, the greatest strength of our platform is that it uses machine learning and rapid feedback to empower experts. Using our tool, experts can quickly test and refine the boundaries that they wish to set on a sector’s definition. Often the platform will challenge even the most experienced experts on their preconceptions of a sector. The resulting lists are almost always better than lists created by just an expert or just a machine-learning process alone.