Product & Working out loud
We’re committed to a culture of working out loud. Sharing our ideas and work as early as we can, and getting feedback from our community.
Find thought-pieces, research papers, product updates, company news and much more on The Data City blog.


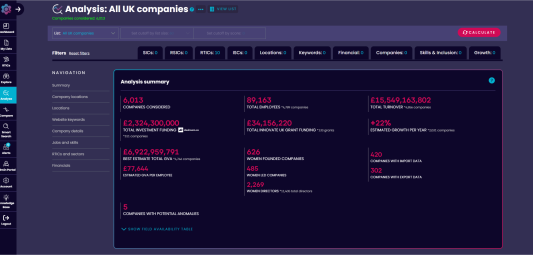


Our platform offers over 400 Real-Time Industrial Classifications (RTICs), created in partnership with industry experts.
Interested in exploring market insights, sector trends, employee data and growth statistic for the country’s fastest-growing industries?
Download one of our free market reports today.