We’ve made some key additions to our platform Data Explorer that allow users access to even more company-level data and ways to identify high-growth companies, regardless of investment status.
As part of our version 4.1 release in October, we were able to bring a host of new features, useful data, and performance improvements to our platform users. An addition that we’re particularly excited about is our suite of new company growth measures that are now discoverable at a company-level in Data Explorer and available for all users right now.
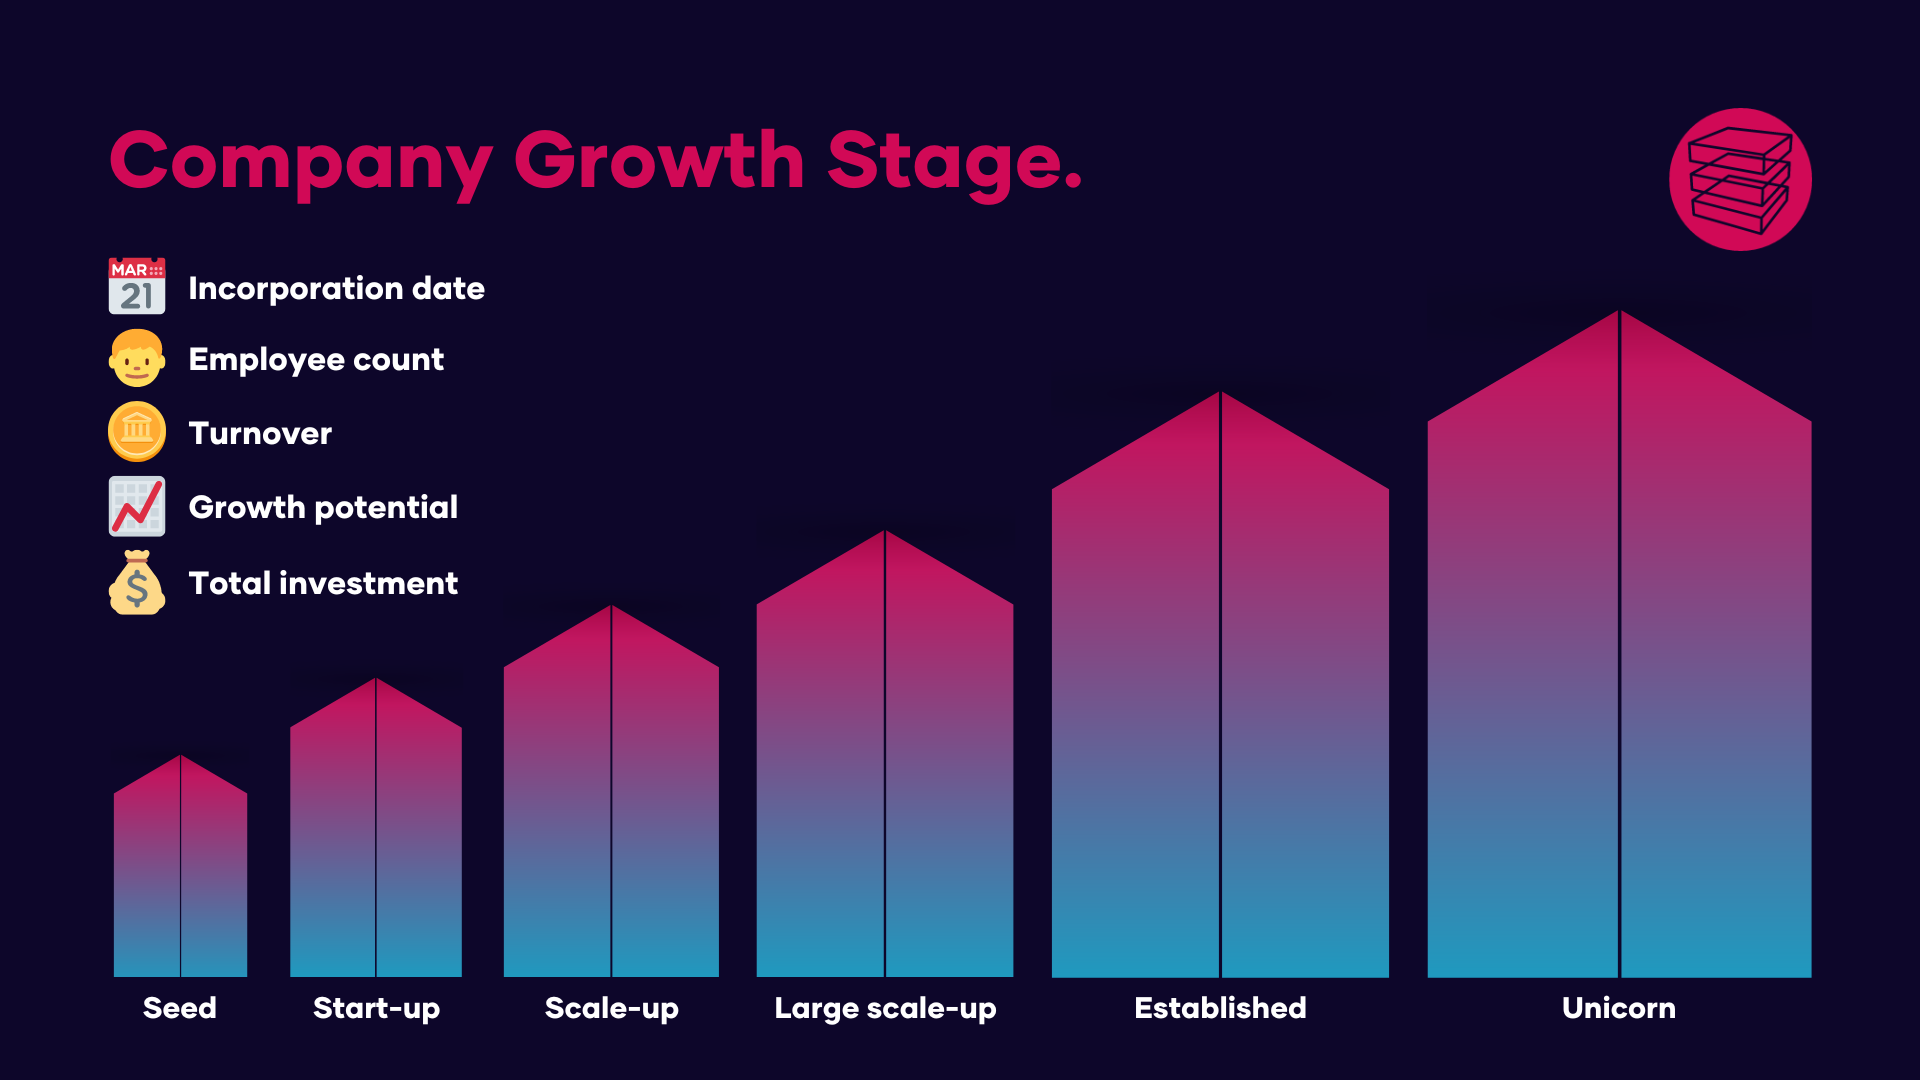
Company growth stage
The first of these metrics is the classification of company growth stage. We can now estimate what stage companies within our extensive database fall under, from seed all the way to unicorn. This ability to classify how established companies are determined allows users to quickly identify company status and growth from the following stages:
- Seed
- Start-up
- Scale-up
- Large scale-up
- Established
- Unicorn
Scottish Enterprise were integral in the development of this classification, supplying us with their growth stage definitions for categorising companies into each stage. We adapted their definitions to suit the variables we have available in the product. Some of our input variables are prioritised over one another and we use a weighted scoring system to get to our end categorisation. This considers incorporation date, employee info, turnover, growth potential and investment data, using specific boundaries (typically a minimum or maximum) for each growth stage that result in the final classification.
The best way to uncover company growth stage data is at a company level, within custom lists, RTICs or in Explore. Simply click for more detail on a company you’re interested in, and you’ll see ‘Company growth stage estimate’ and their individual classification. Easy!
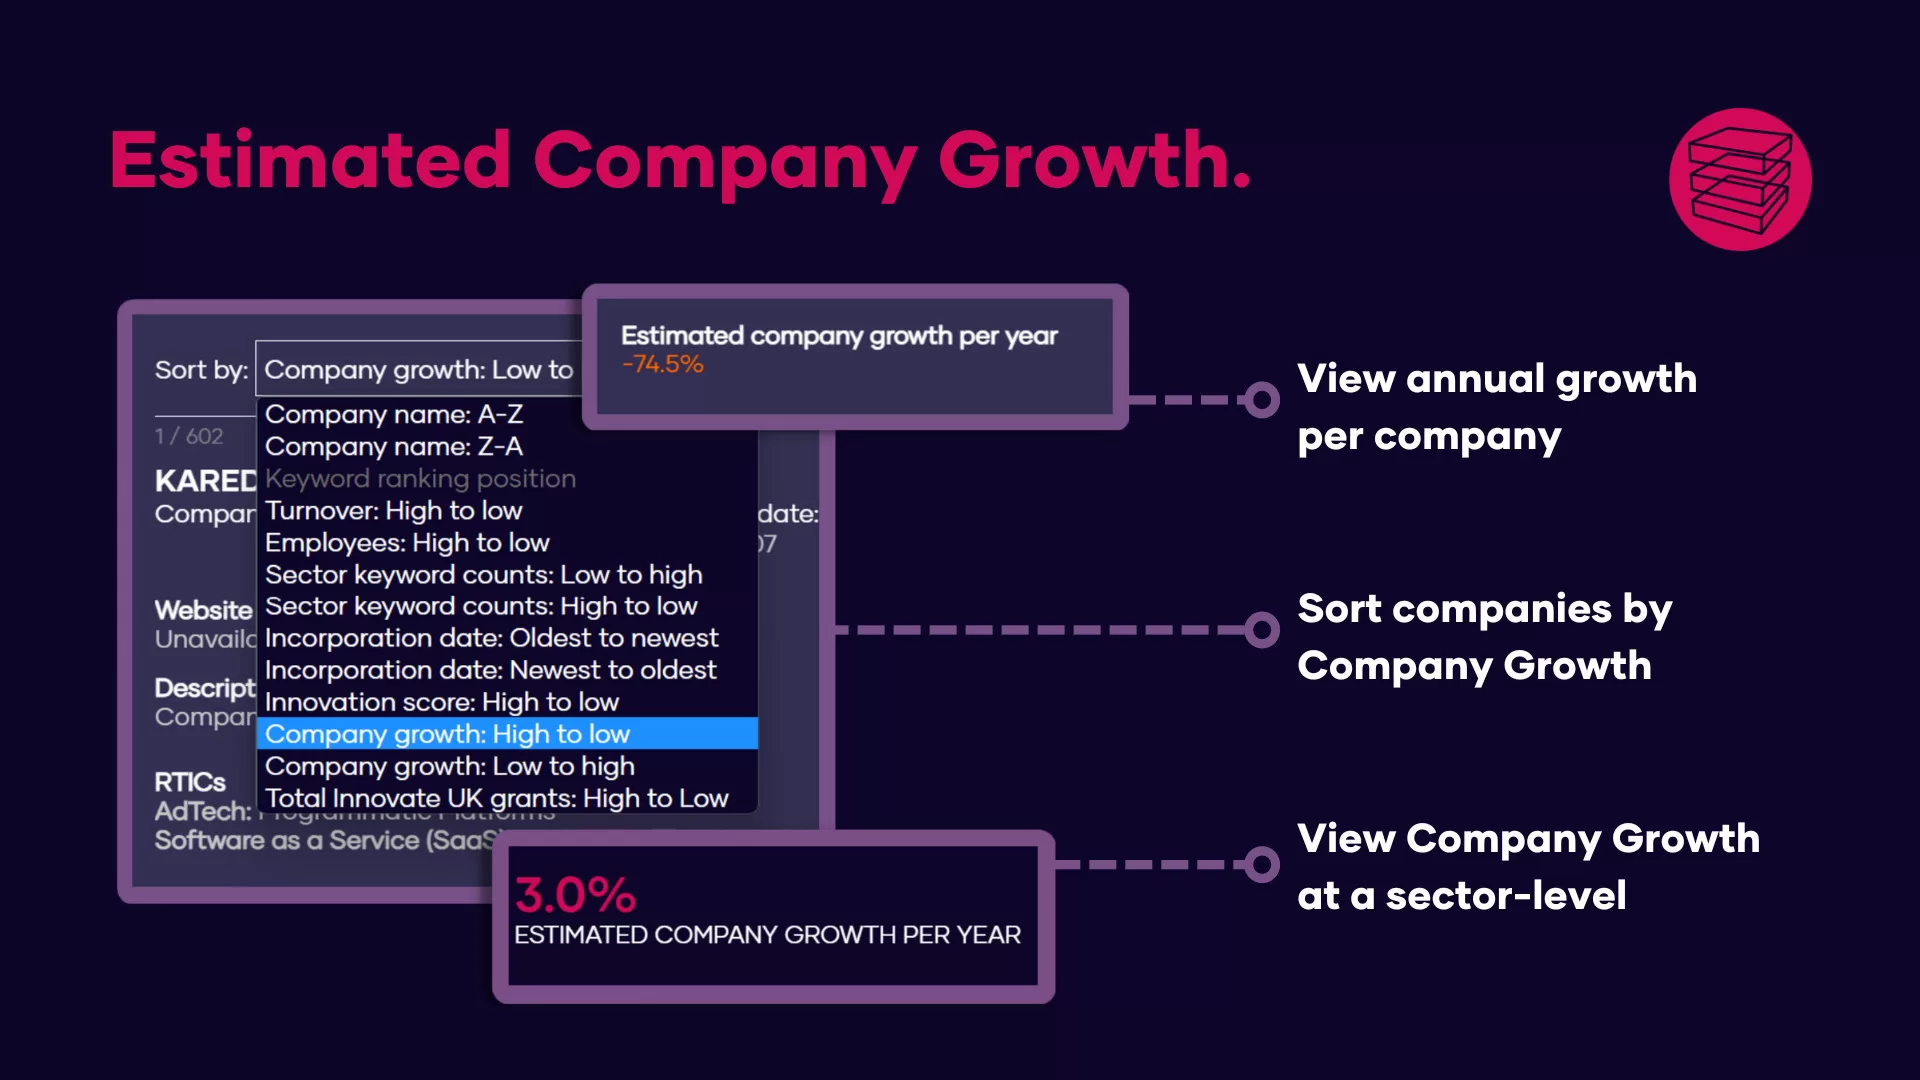
Estimated company growth
As well as our new company growth stage measure, users can also now access estimated company growth per year within our platform – showcased as a percentage, alternatively known as average annual growth rate.
Our estimated company growth per year represents Compound Annual Growth Rate (CAGR). Where a given company has at least three years of Turnover and Number of Employees, we create two CAGR values retrospectively. We average the result to create a single estimated company growth %. We determine a trend growth rate using linear regression to support with the changing growth rate between each year and to support with missing data.
This allows users to quickly spot high-growth companies at all stages, regardless of investment and funding, if we hold at least three years of turnover and employee data. We currently house estimated company growth rates for a whopping 2 million companies in our database.
You can now find Estimated company growth per year alongside Growth stage at company-level, accessible through lists, RTICs or in Explore.
Accessing our data
We’re excited to be adding these new company growth measures to our platform for current users. We think they’ll be particularly helpful for deal origination, prospecting and for those working in corporate finance. And it’s not the end! In the coming months we’ll be expanding on our growth metrics, with more ways for users to search, filter and analyse Company growth rate and stage.
If you’re interested in seeing our data firsthand, or have a questions about our company growth measure, we’d love to hear from you. Simply contact us today and we’ll set up a call.