




We’ve offered a measure of Gross Value Added (GVA) and productivity on our platform since July 2023, helping users understand the impact a sector or group of companies has on the economy.
We’ve now taken this a step further with a more bespoke approach. Just as our Real-Time Industrial Classifications and other classifications have given us a clearer view of the frontier economy, our enhanced GVA methodology now lets us measure it more precisely.
What is GVA?
Gross Value Added (GVA) measures the value a company creates. You start with what a business earns from selling its goods and services, then subtract what it spends on the things it buys to make them.
A bakery sells £100,000 of bread and cakes a year. It spends £40,000 on flour, butter and other ingredients. The remaining £60,000 is the value the bakery has added, and it gets split between the staff’s wages and the owner’s profit
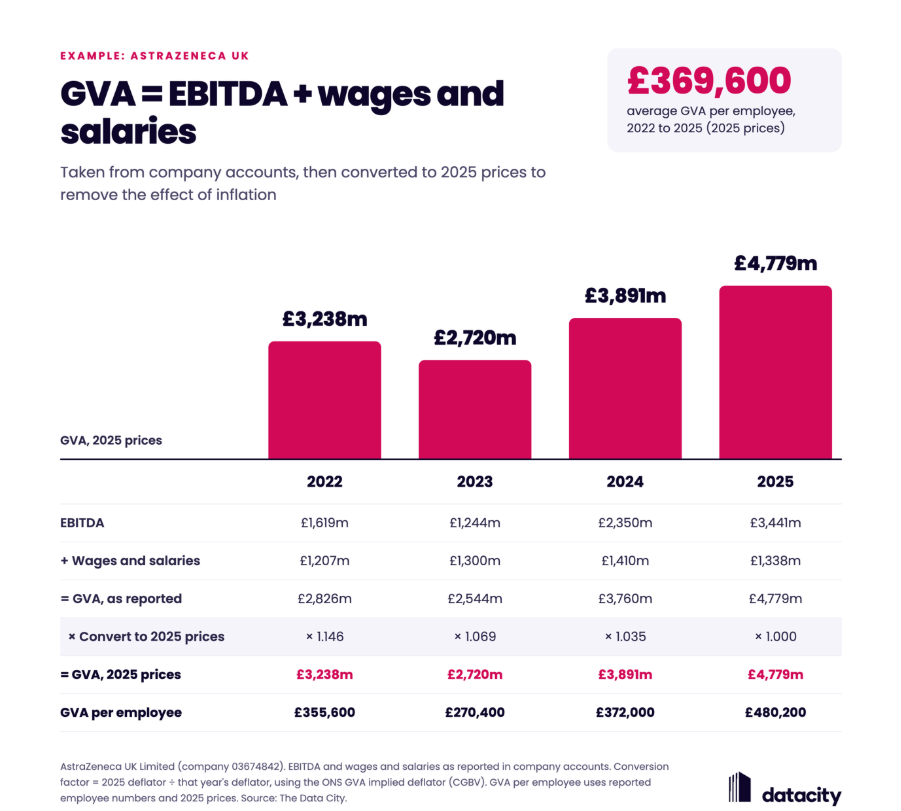
So, if you know a company’s profit (EBITDA) and its wage bill, you can calculate its GVA, and that’s the approach we take. We add up GVA across every company in a sector, and you see how much that sector contributes to the economy. Divided by the number of people the sector employs, it gives GVA per employee, a standard measure of productivity.
What’s changed?
In short, you’ll now get measured values of GVA for companies that provide enough information, and you’ll no longer get company estimates of GVA for all companies with employees and SIC codes. This change has allowed us to improve our estimates for frontier sectors, whilst maintaining comparability with figures you would get from official statistics.
More specifically, our old methodology used official statistics as an input. This allowed us to provide an estimate of GVA for every company, provided they had employees and an SIC code. Our classifications, like RTICs, have moved beyond SIC to capture the frontier. But it was difficult for us to measure the GVA of the frontier accurately, as estimates relied on SIC codes.
The change that we’ve made is removing the dependence on SIC by drawing on measured, company-level data. This better pairs up with our approach to classifications, which uses companies’ websites to classify what they do and not their SIC codes.
For us to directly calculate GVA, we need companies to report profit (EBITDA) and their wage bill for at least one year. Around 60,000 companies report enough information to calculate a direct estimate of GVA.
The infographic below shows how we measure GVA, using AstraZeneca as an example. We calculate AstraZeneca’s GVA using its EBITDA and wages and salaries over 4 years. The values fluctuate from year to year, and there is no meaningful interpretation of this. So, we average across the years to remove this noise.
As mentioned, we don’t have measured data for all companies. But, when you analyse a list of companies on the Industry Engine, we check for companies in the list that have measured GVA values. We then use these values as a sample to estimate productivity and GVA for your entire list.
We’ll only provide an estimate of GVA for your list if we can have confidence in the underlying measured values. That means, if there are not enough companies in your list with measured GVA values, we won’t provide an estimate for your list. Similarly, if the measured values are too variable, then we won’t provide an estimate. We’re able to give a confident measure of GVA for 70% of RTICs.
What this means for you
GVA has helped our clients understand what contribution a sector makes to the overall economy. With the change in methodology, users of our Industry Engine will be better able to understand the most productive parts of the economy.
To better understand the frontier economy, our Chief Economist Paul has used the data in an article in The Observer. He found that the frontier economy is 60% more productive than the non-frontier, as well as it being overrepresented for employment and investment.
At the same time, we’ve maintained comparability with official statistics for other parts of the economy. The chart below shows how GVA per employee compares between the new method, the old method, and published official statistics from the Annual Business Survey (ABS). The new method is slightly closer to the official statistics value, when looking at the 14 SIC sections covered by the ABS.
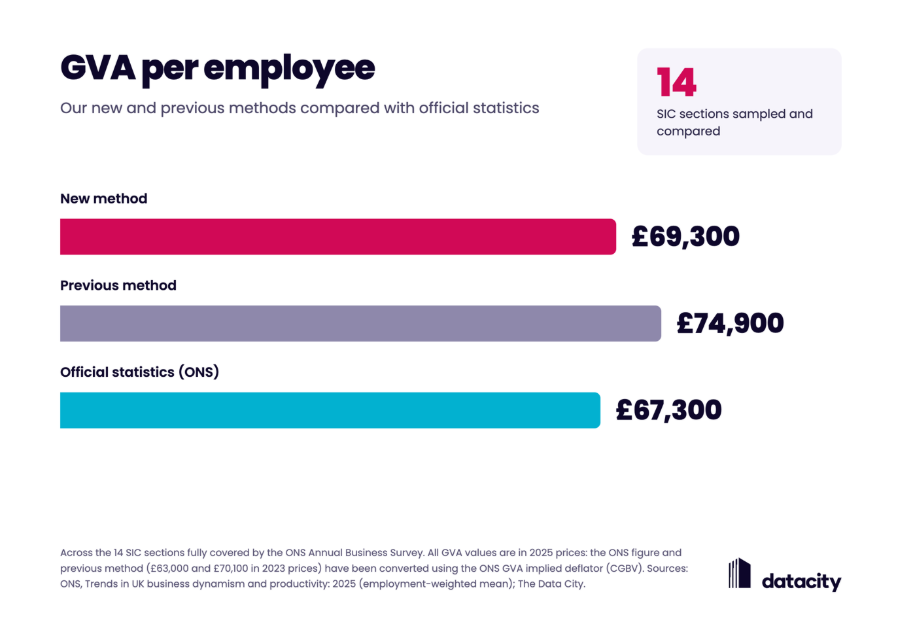
Our new approach matches official statistics on both inputs and outputs. The official statistics we used previously drew on a sample of around 50,000 companies once the survey response rate was factored in. Our new method uses a similar sample size and produces similar values for SIC-based analysis.
The biggest gain is in frontier sectors, where our GVA estimates are now much clearer. To make that improvement, we’ve moved away from company-level estimates. We based this decision on how customers use our platform: 82% of our users’ sector analyses involve RTICs or Industrial Strategy sectors.
We’re confident this change will benefit more of our customers than per-company estimates did. If you’ve been downloading company-level GVA estimates, you’ll need to adjust your workflow, and we’re here to help with that.
Get in touch and, we’ll share guidance on the best way forward.
See the frontier economy for yourself
New to The Data City? Start a free trial of the Industry Engine and test the new GVA figures on the sectors you care about. Build a list of companies, pick an RTIC, and see how productive that part of the economy really is.