




The University Industry Impact Explorer (UIIE) already shows you your institution’s connections to industry: every spinout, research collaboration, Innovate UK partnership and alumni director, mapped and classified against the IS-8. Read more about the UIIE
But spinouts and grants only tell you about the companies your university works with directly. They say nothing about the thousands of people who leave with a degree and go and work somewhere else. Graduate Flows, a new feature on the UIIE, answers that question: which companies employ your graduates, in which sectors, and in which parts of the country.
What it’s built from
Graduate Flows uses Lightcast profile data, which records where someone studied and where they work now. We keep graduates of the universities we cover whose current employer is a UK company we can match to Companies House, and count each graduate once, against that employer. Someone who graduated from two of our universities is counted for both.
“Recent” means graduating between 2021 and 2026. This is a live snapshot of where people work today, not an official graduate destinations survey, so don’t expect it to line up exactly with HESA or Graduate Outcomes figures.
Two Charts, Two Different Counts
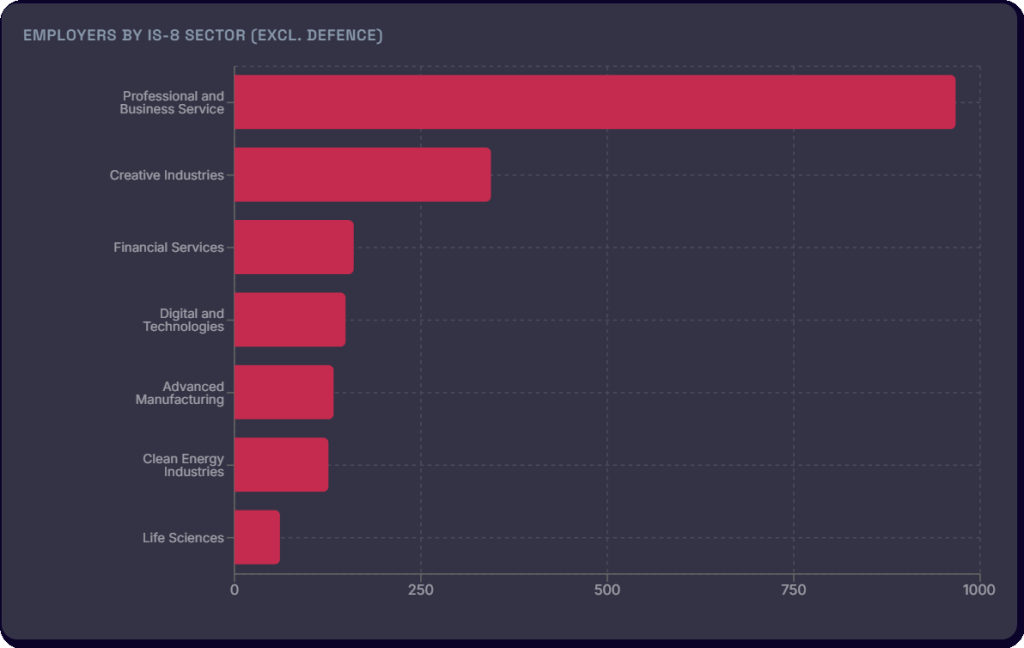
Employers by IS-8 sector
Counts companies, not people, and leaves out Defence. It shows which IS-8 sectors your graduates’ employers sit in, so you can see where your alumni base clusters.
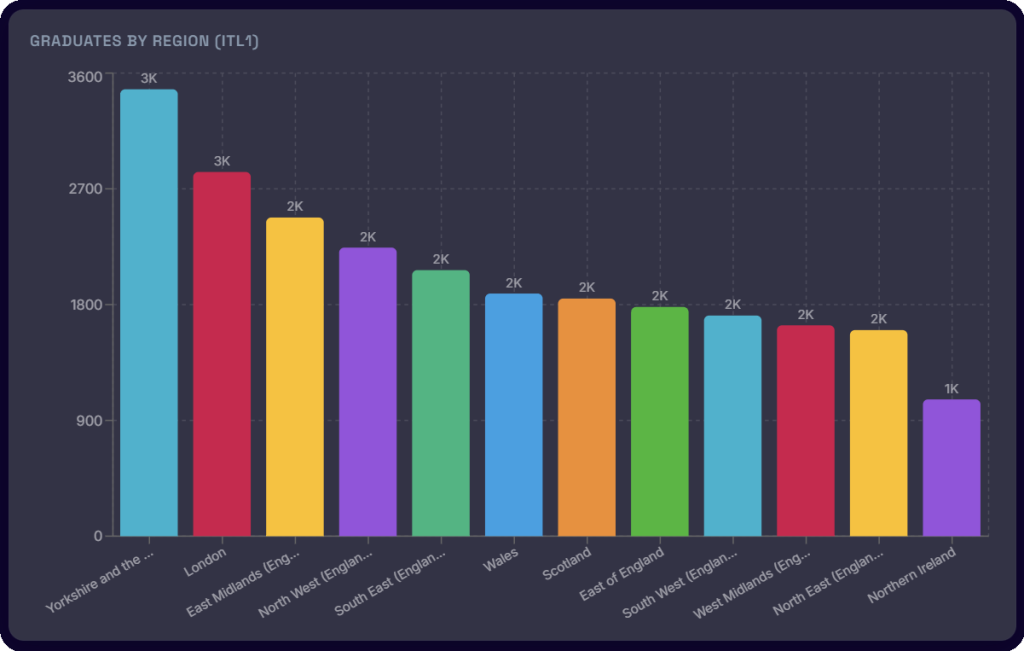
Graduates by region
Counts people, placed by where their employer has offices. A graduate whose employer has offices in more than one region is counted in each of those regions. That’s intentional, but it means the regional bars can add up to more than your total graduate count. Don’t read them as a breakdown that sums to 100%.
Take Sheffield Hallam. Professional and Business Services and Creative Industries are its two largest employer sectors by a wide margin. Regionally, Yorkshire and the Humber and London take the largest national shares, while South Yorkshire and West Yorkshire lead the more local, strategic-authority view: a university retaining talent close to home while still feeding London’s graduate market.
What’s under-counted
We can’t count anyone Lightcast has no profile for, or anyone whose employer isn’t a UK-registered company we’ve matched, which rules out the public sector, overseas employers, and the self-employed. For Sheffield Hallam, 503 graduates fall into this gap: left out of the regional charts but still included in the totals and the IS-8 sector view.
This is a view of graduates working for matchable UK companies, which is exactly the group a knowledge exchange team can build a relationship with, or a careers service can point students toward.
Why this is useful
For HEIF and REF-adjacent reporting, Graduate Flows gives you a defensible answer to “where do your graduates go, and are they going into IS-8 sectors?” For careers teams, it’s a live map of who’s hiring your alumni, by region and by growth sector, to target the next round of employer outreach. For business development, it’s a way to check whether your graduate pipeline into a sector matches your spinout and research activity in that same sector.
See it on your own institution
Graduate Flows is available now inside the UIIE, alongside the Dashboard, Leaderboard and Industrial Strategy views.
Start a free trial or book a demo to see your institution’s own Graduate Flows charts.