





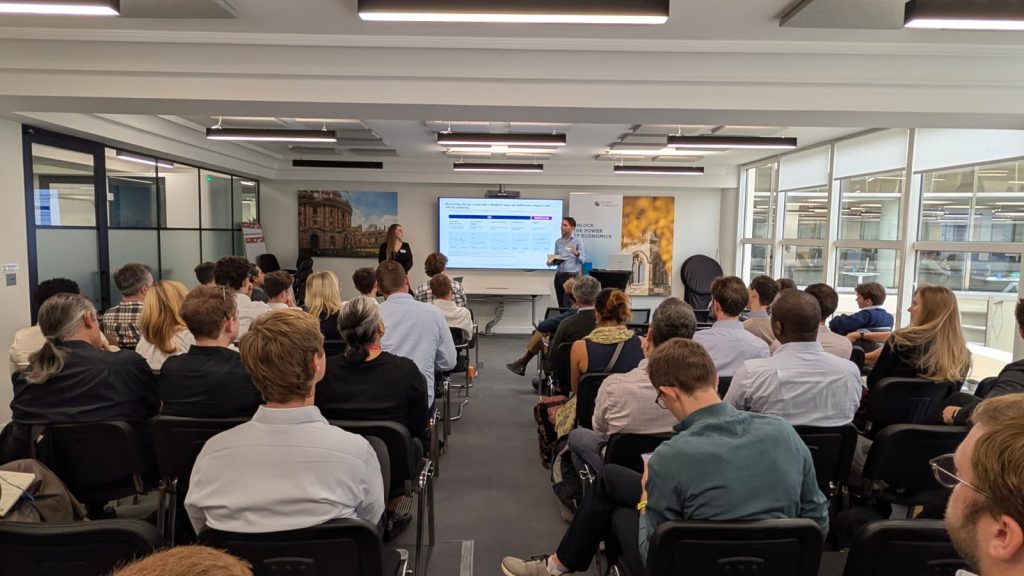
A year after the Industrial Strategy put eight growth-driving sectors at the heart of economic policy, one question matters more than most: how do we know whether it’s working? Last week The Data City brought together economists, analysts and policymakers from across government and beyond for a half-day workshop on exactly that.
The problem: you can’t manage what you can’t measure
Many of the sectors identified in the Industrial Strategy don’t map neatly onto the Standard Industrial Classification. SIC was built for consistent measurement over time, using fixed categories. It captures some IS-8 sectors well, others only partially or through proxies, and some barely at all. A company building technology for clean energy or developing new defence electronics can easily vanish into a generic category.
That leaves a gap at the centre of the Strategy. Without a workable definition of each sector, it isn’t possible to monitor how the sectors are doing or to evaluate whether policy is making a difference.
Filling the gap from the company level up
Our opening session set out how The Data City has built definitions for the IS-8 sectors. Every sector resolves to named companies, with their SIC codes, Real-Time SIC codes (RSICs), Real-Time Industrial Classifications (RTICs) and Industrial Strategy sectors side by side. Having a definition at all is new: for the first time, the Industrial Strategy can be measured on its own terms.
The real value lies not just in having company counts, but in what the definitions let you connect. Because the data is built from individual companies, it can be combined with other information to answer questions official statistics can’t yet reach:
- Geography. Where each sector concentrates, down to a very local level.
- Investment. Which places attract funding, and at what stage of company growth.
- Cross-sector activity. Defence companies, for example, show up heavily in advanced manufacturing, space and electronics too.
- Skills demand. Using job postings data, the differences in skills demand across IS-8 sectors turn out to be smaller than you might expect.
We also showed how this answers live policy questions. Take one that comes up often: is higher defence spending the answer for “left behind” places? For a few places, perhaps. In Cumbria, defence really is the local economy. In general, though, the most innovative defence companies are concentrated in places that are already highly productive. Spending more on defence is therefore likely to benefit places that are already ahead more than places that are behind.
Forecasting the frontier
Oxford Economics showed how combining its forecasting models with our real-time classifications makes it possible to forecast Industrial Strategy employment at a very local level. Their findings highlight how concentrated this activity is. Half of all frontier jobs sit in just 100 one-kilometre hexagons, and a third in just 20. Those few places will do a great deal to decide the success of the UK economy this century. Their work also showed cities on different paths. Some, such as Edinburgh and Derby, are specialising and expanding at the same time. Others, such as Cambridge, are growing across many sectors at once.
What we heard from government
Civil servants working on delivering the Industrial Strategy shared how they are approaching measurement. Three themes stood out:
- Official classifications leave real gaps. Measuring the IS-8 properly needs company-level approaches alongside official statistics, and they are using the former top complement the latter. While big data comes with caveats, it’s an important tool helping government to answer policy questions.
- Place and inclusion matter. The data shows that IS-8 firms tend to cluster together, mostly in already productive places. That raises hard questions about how the Strategy’s benefits reach every part of the country.
- Good definitions need ongoing care. Company-level definitions need expert judgement, transparency and regular maintenance. Sectors evolve, companies start up, pivot and close, and an updated list is a new snapshot rather than a simple measure of growth.
That last point is one we welcome. RTICs are built with subject-matter experts, using both positive and negative training examples, and retrained as sectors change. This workshop was an opportunity to share that process openly with the people who rely on the data.
What comes next
We closed with an open discussion on the future of data infrastructure: what the economy needs measured next, and what it will take to get there. This gave us all strong steers on what we need to do to continue to support the Government’s efforts to boost the economy.
Thank you to everyone who took part. If you’d like to find out how our IS-8 data could support your work, get in touch.