Which are the UK’s most innovative companies? Our customers and partners often ask us this question and we’ve been working with them to try answer the question for years.
In recent months our estimates have met the quality requirements we set ourselves and an innovation score for every company in the UK is now available in both our EXPLORE and ANALYSE platforms. We identify 100,000 companies as likely to be highly innovative. Of these, we identify 5,000 which deserve extra attention.
This blog post contains some background on the work that has gone into developing this new data point, some thoughts on how it might be useful, and some discussion of the data’s limitations.
Background: developing an innovation score.
Every two years the Central Bureau of Statistics of the Netherlands (CBS) surveys around 10,000 Dutch companies and score their activities against a variety of measures of innovation. Using this dataset the CBS has shown that the website text of a company can accurately predict its innovativeness score.
The ONS performs a similar national innovation survey on behalf of the UK that surveys 30,000 companies. If we had access to the raw data from this survey we could use our database of company websites to calculate an innovation score for all UK companies in our database, but we do not.
Without access to the national innovation survey microdata we have been searching for other proxies of company innovation. Now, by combining multiple data sources, we have been able to train a machine learning model that reliably estimates if a company is significantly more likely to be highly innovative based only on the content of its website.
Data on innovation.
Instead of using innovation survey data as a proxy for the innovativeness of a company, our method uses data on R&D expenditure data at the company level.
This data is not easy to collect. Companies are not required to report R&D spending in their annual accounts and this field is only very rarely reported voluntarily. A further difficulty is that while most UK company accounts are available in the machine-readable XBRL format, R&D expenditure is often marked up improperly within the documents even where it is reported.
Solving these problems has meant parsing 1.5TB of machine-readable accounts in XBRL format and experimenting with OCR at scale. We supplemented this R&D intensity data with data from other sources, including the European Commission’s work on highly innovative firms. Today we have a dataset of turnover, employee count, full website text, and R&D spending for over 800 UK registered companies. These 800 companies cover a wide range of R&D intensities and business sizes. They operate in all regions of the UK and in all industrial sectors.
Our methods
In line with the work of the CBS, we evaluated many machine learning models to see how well the website text of a company could estimate its level of innovation.
Among the tests carried out were,
- Using different measures such as R&D spending per £ of revenue or R&D spending per employee as proxies for company innovation.
- Using different feature extraction methods in the data preparation phase.
- Using different classification and regression algorithms.
- Using different cut-off points for distinguishing between a high innovation and a low innovation company.
A large part of our time testing was focused on whether companies were best classified using,
- A binary classifier (this splits companies into high innovation and low innovation groups).
- A multi-class classifier (this splits companies into very high innovation, high innovation, medium innovation, low innovation, very low innovation, etc…).
- A continuous classifier (this estimates a precise R&D intensity for each company).
We applied cross-validation procedures to evaluate the accuracy of our methods during prototyping and then selected a model for final deployment which was as reliably accurate as possible. In large part due to the distribution of R&D intensity across companies (most companies spend below the mean amount) the binary classifier models worked best.
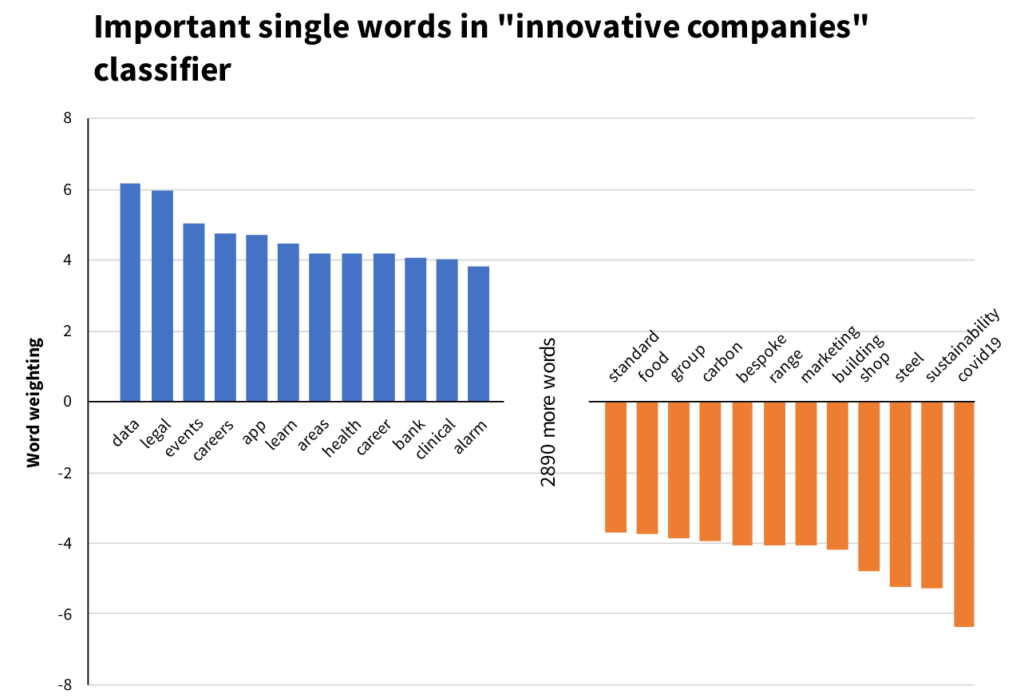
Key phrase analysis of the final model shows which words on websites most powerfully influence whether a company will be classified as low innovation or high innovation.
Making the innovation score available to you.
Our final model is trained on the full set of 800 companies with known R&D intensities. This model is then used to estimate a level of innovation, high or low, for 1.6 million companies in the UK.
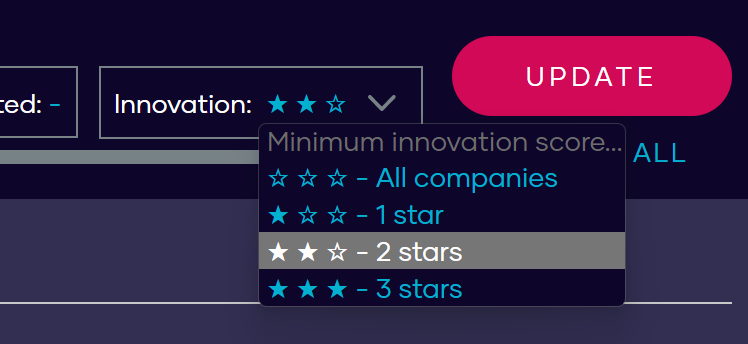
After early testing with our customers we added a feature that filters companies by our confidence that they are in the high innovation group.
Zero stars mean that we think a company is a low innovator.
1 star, 2 stars, and 3 stars means that we think a company is a high innovator with varying levels of confidence from 60% to over 90%.
Filtering companies by innovation score is now included in our EXPLORE and ANALYSE platforms, with the feature coming to ML Lists soon.
We already know that our customers are using the innovation score in interesting ways. These include identifying innovative companies in high-growth sectors to target investments, identifying less-innovative companies in fast-growing sectors and offering them targeted support, and quantifying the strongest sectors of innovation in different regional economies to focus government interventions where they are more likely to generate the best return.
We look forward to seeing even more uses of this data and we are improving our tools where possible to make the required analysis easier and quicker.
Future development
The fastest way for us to improve our innovation score would be to have more data on the level of innovation within UK companies. We are looking at three ways of doing this,
- By improving our methods for extracting R&D spending data from UK company accounts. Any increase in the amount of voluntary reporting of R&D spending by UK companies would improve this.
- By exploring the potential to access to the UK’s innovation survey microdata to provide a training set similar to that used by the CBS in the Netherlands.
- By asking the UK government to publish the amount of R&D tax credits paid to every company in the UK.
If you can think of other ways we could improve, or have a project that you think would benefit from our innovation scoring projects, please don’t hesitate to contact us.