RTICS, or real-time industrial classifications, are made up of industry verticals generated using a proprietary methodology that analyses how companies describe themselves on their websites.
To power the generation of RTICs, we have designed a cutting-edge supervised machine-learning algorithm. The magic happens when we feed company websites that represent the sectors of interest—as well as ones outside these sectors—into our platform, forming the training set. Our algorithm carefully studies this data to understand the nuances and language peculiarities of each sector. When presented with new company websites, it can swiftly identify those that describe their activities similarly to those in the training set. As a result, we curate a refined database that includes companies using specialised language for their respective sectors, activities, or supply chain nodes.
RTIC creation
To create an RTIC, we go through the following process:
Step 1: Taxonomy development
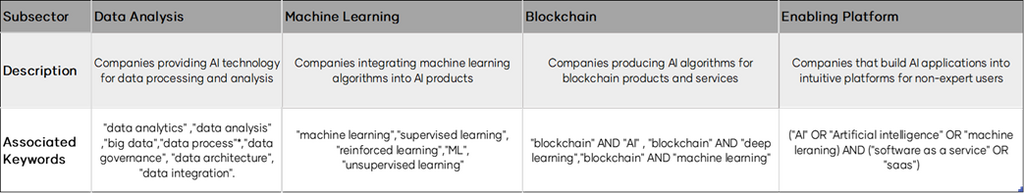
To make the RTIC representative, it’s crucial to define various pockets of the sector with shared language patterns. This taxonomy formation guides the machine learning process by identifying segments of activity within a sector. Industry verticals are defined based on keywords and phrases representing their activity, technology, or supply chain role. The taxonomy creation involves desk research, analysing company websites, choosing an approach (such as technology or applications), and selecting initial training websites. We select these websites through expert input, existing databases or keyword searches.
Step 2: Data RTIC production
Once we have our initial training set selected, we then run the machine learning list for each individual vertical. This is an iterative process that involves updating the negative training set with companies that are not relevant to the sector. Upon completing this exercise, we share the first iteration of lists with experts for review. The experts help to shape the lists, either by making changes to the training set, or by making sure the list is representative of the sector. Once signed off, we publish this data on the platform as an RTIC.
Step 3: Quality assurance
Quality assurance is a key part of developing our RTICs and is key to maintaining the accuracy of the platform. A meticulous quality assurance process is performed with the data before being published in the RTIC. This process involves checking the accuracy of the URL, as well as the accuracy of the machine learning exercise at both the RTIC and vertical levels. The Data City’s published data has a minimum confidence level of 90%.
The RTIC data undergoes an annual update, involving a meticulous review of training sets and thorough cleansing of lists. Certain key RTICs receive biannual updates, particularly when the platform undergoes significant advancements or developmental changes. We believe that RTICs are the best way to understand the emerging economy (especially if you combine them with other data sources). We highly value customer feedback, and pride ourselves on being adaptable in order to improve our products. We’ll always consider valuable suggestions in order to keep our platform up-to-date and user-friendly. For example, the platform lets users directly report any mismatched RTIC for any company quickly and easily.
Keyword best practices
Data Explorer users commonly utilise keywords to identify companies for training sets in machine learning exercises, to fine-tune searches in explore, and to retrieve more relevant and targeted companies for analysis. The keywords search we generally use in list building follows Boolean logic. Keywords are powerful tools for targeting specific areas, but must be used with caution.
Common advanced search queries to use to get the best out of keywords are:
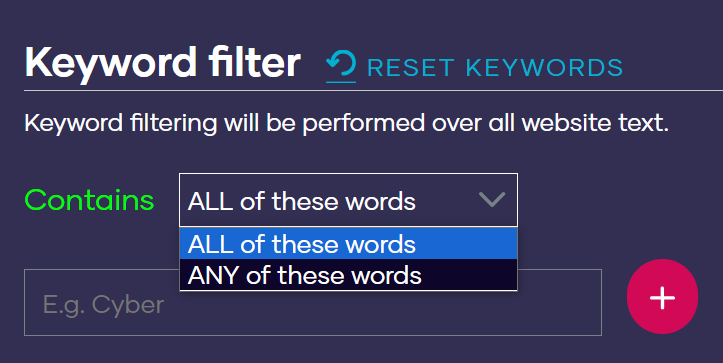
Use the ‘ALL of these words’ tab when you have a set of keywords and want to find companies that use all of the keywords that you have mentioned in their website text. If you want to find companies using any one of the listed keywords, then select ‘ANY of these words’.
- Using “” between words helps in identifying companies with the same keyword referenced in your search. For example: “data analytics”
- Combining keywords with AND and OR queries. For example: “Data Analytics” AND “Machine learning” will return companies that use both data analytics and machine learning in their website text.
- Using NEAR in searches, for example: NEAR (“Data” “insights” , 5)) you are letting the platform output companies that have ‘data’ and ‘insights’ within 5 words of each other.
- Using Asterix, for example “data analy”* this is to let the platform to match companies that use data analysis, data analytics etc.
- We can combine multiple searches in keywords. For example, the following search returns all the companies that work with machine learning or data analytics within the artificial intelligence sector.
(“Artificial Intelligence” OR “AI”) AND (“Data analy”* OR “machine learning”)
- In the most advanced applications of this technology we develop complex keyword searches such as:
(“artificial intelligence” OR “ai” OR “neural networks” OR “deep learning” OR “machine learning”) AND (“data analytics” OR “data analysis” OR “insight”* OR “big data” OR “data process”* OR “data governance” OR “data management” OR “data architecture” OR “data integration” OR “professional services” OR “predict”* OR “outlier”* OR “pattern”*)
Wrapping Up
In conclusion, RTICs possess a distinctive strength in effectively mapping the landscape of the emerging economy. RTICs evolve alongside the ever-changing business landscape and are not bound by static definitions. This adaptability empowers researchers, analysts, and decision-makers to stay ahead of the curve, as they can quickly access data that reflects the latest developments within the emerging economy.