Yesterday, The Data City hosted the second session in our Industrial Strategy working group series, bringing together experts from government, academia and industry to tackle a key challenge:
How should we measure the performance of the UK’s priority sectors and at what geography?
Because as this session showed, where you look can completely change what you see.
The geography problem
We often rely on administrative boundaries, local authorities, regions, nations to understand how the economy is performing, but much like SIC codes, these boundaries don’t always reflect how the economy actually works.
They’re convenient and standardised, but they often hide what’s actually happening. This session was about breaking that down.
Zooming in changes the story
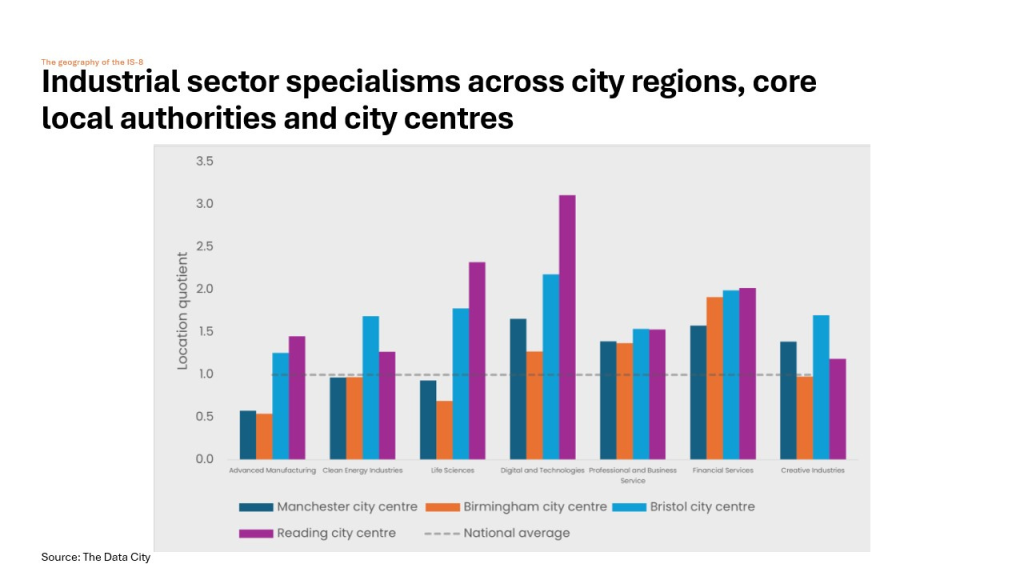
Paul Swinney, our Chief Economist explored how different geographic levels can tell very different stories.
Looking across large city-regions like Greater Manchester or the West Midlands, there appears to be relatively little specialisation in the Industrial Strategy’s priority sectors.
But when you zoom in to the city centre, the picture changes (see chart below).
Both Manchester and Birmingham city centres perform strongly across multiple priority sectors. These areas act as concentrated hubs of activity but they’re geographically small, meaning their impact is diluted when viewed at a wider level
The takeaway is simple: the level at which you analyse the economy matters.
Activity is even more concentrated than you think
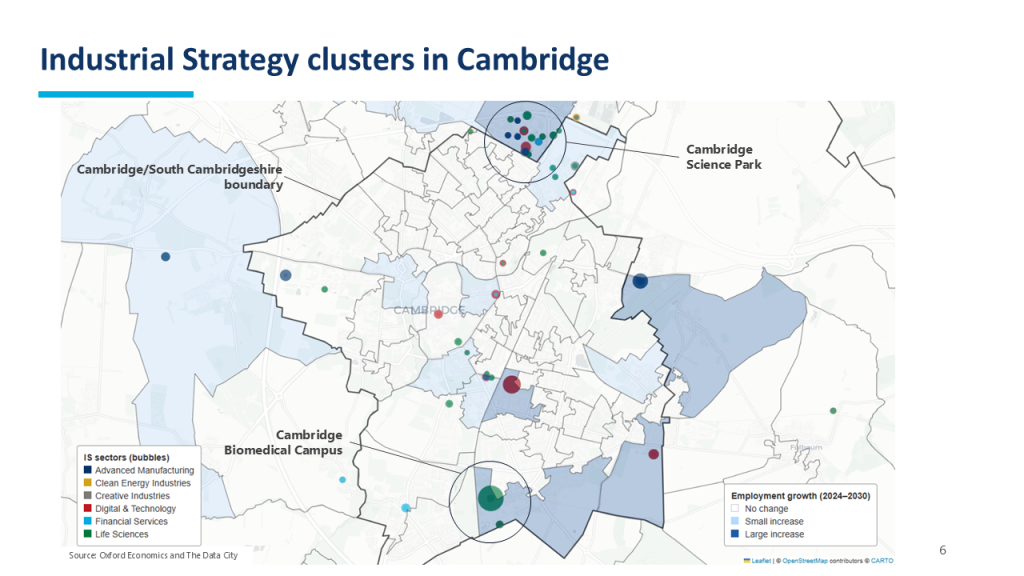
Csaba Pogonyi, Lead Urban Economist from Oxford Economics took this further by showing just how tightly clustered activity can be.
Using detailed mapping of cities like Cambridge and Manchester, the data revealed that:
In Cambridge, activity is heavily concentrated around specific sites:
- Cambridge Science Park (north)
- Cambridge Biomedical Campus (south)
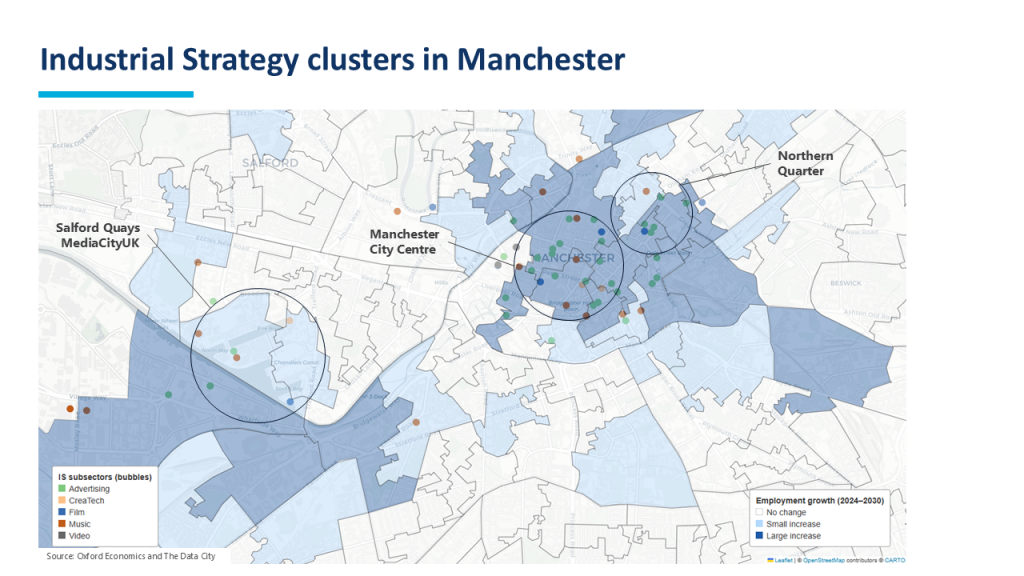
In Manchester, similar clustering appears.
This isn’t just regional concentration; it’s hyper-local clustering and it reinforces the idea that understanding the Industrial Strategy requires going beyond standard geographies.
Looking globally: the data challenge
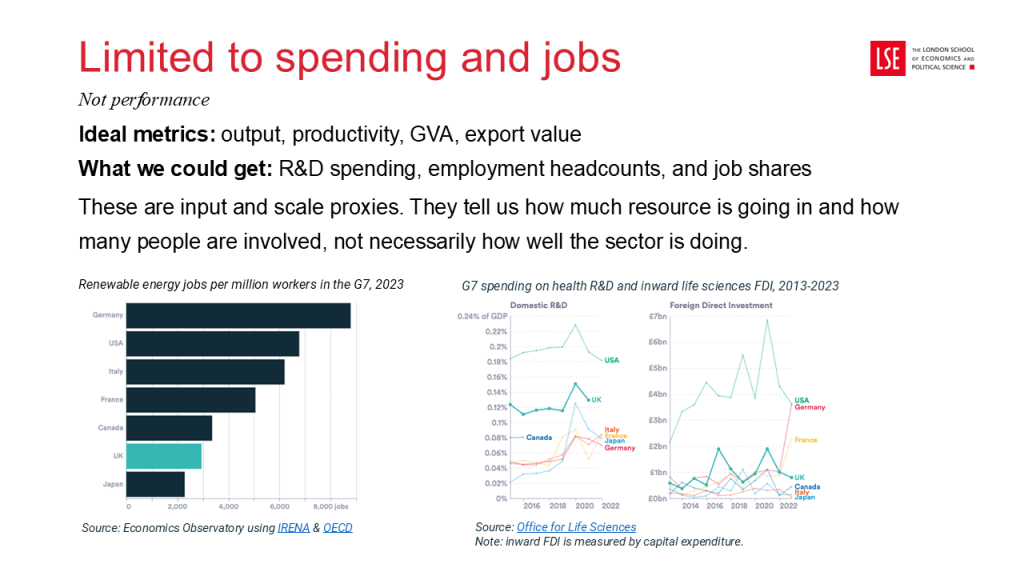
At the other end of the spectrum, Will Shepherd, Researcher from London School of Economics and Political Science explored how the UK compares internationally.
Looking across countries is a well-established approach but it comes with its own challenges.
To benchmark the UK’s IS-8 sectors against other G7 nations, Will had to rely on proxy measures of the sectors, such as R&D into health.
These give a sense of scale, but not true performance. The underlying issue is consistent with the rest of the discussion: the data we need doesn’t properly exist yet.
Not just within the UK, but internationally too.
What comes next
This is where The Data City’s work comes in.
We’re building real-time industrial data across multiple countries, including the USA, France, Germany and Ireland.
Because we apply the same methodology across each territory, this will enable:
- Consistent, cross-country comparisons
- A clearer view of how priority sectors perform internationally
- A stronger evidence base for policymakers
For the first time, it will be possible to compare like-for-like across borders using data that reflects what companies actually do.
Why this matters
This session reinforced a core idea behind the working group: how you define and measure the economy shapes how you understand it, and how you support it.
Administrative boundaries don’t always reflect economic reality and sector activity is often highly concentrated and without better data, both local and international comparisons remain limited
A growing conversation
This webinar is part of an ongoing series bringing together leading voices to help shape how the Industrial Strategy is understood and delivered.
Watch the session & explore the data
You can dive deeper into the data, methodology and discussion by watching the full session.
Or, if you want to see how this works in practice, you can explore the data yourself in the Industry Engine with a free trial.
Want to contribute to the next session?
We’re always looking to bring new perspectives into the working group.
If you’re working on Industrial Strategy, sector mapping, place-based analysis or anything related to how we measure the economy, we’d like to hear from you.
We’re particularly interested in practical examples, new methodologies and real-world applications of data.
If you’d like to present at a future session, get in touch with us.