




The City of London Corporation commissioned Arup to deliver a spatial economic analysis of the Square Mile, to help the City of London’s Corporation better understand the economic dynamics within its boundaries and secure their future competitive position.
Analysing a place as economically dense as the city demanded more granularity and foresight than traditional datasets could offer. To fully respond to the brief, Arup needed additional insight and data resolution that enabled businesses to be identified and classified at street level, while also capturing emerging sectors that sit outside Standard Industrial Classifications (SIC).
That is where we were brought in.
We supported the analysis with granular, real-time company-level data and our Real-Time Industrial Classifications (RTICs), enabling a much more detailed view of the city’s business ecosystem than is possible using conventional datasets alone.
The result is a major spatial economic study of the Square Mile, mapping the city’s business base and identifying spatial clusters across key sectors including finance and insurance, legal services, technology, professional services, the built environment, and the creative industries, as well as their emerging sub-sectors such as FinTech and AI. The outputs will support the City Corporation in shaping the strategic future of one of the world’s most important economic centres.
We are proud to have supported this work alongside Arup.
The need for novel data
Understanding a place as economically dense and complex as the City of London requires a far finer level of resolution than official statistics can typically provide.
A key limitation of traditional datasets is that they often struggle to distinguish between businesses that are simply registered in a specific area and those that are actually operating there. Considering the incredible attractiveness of the city of London’s postcodes for businesses that seek prestige and recognisable addresses, any analysis that did not distinguish between the two risked to provide a skewed picture of the city’s local business base.
Traditional classifications also have limited ability to capture emerging and fast-moving sectors such as FinTech, Cyber, Net Zero, PropTech, and Artificial Intelligence, which cut across multiple Standard Industrial Classification (SIC) codes or are not well represented within them.
This is exactly the gap that our Real-Time Industrial Classifications (RTICs) were designed to solve.
Where our data came in
Across the sectoral analysis, Arup drew on The Data City platform to identify, classify, and map businesses across the city and its surrounding area. Each of the sector cluster maps in the analysis, from financial services and insurance to cloud computing, PropTech, and digital creative industries is underpinned by our company-level dataset.
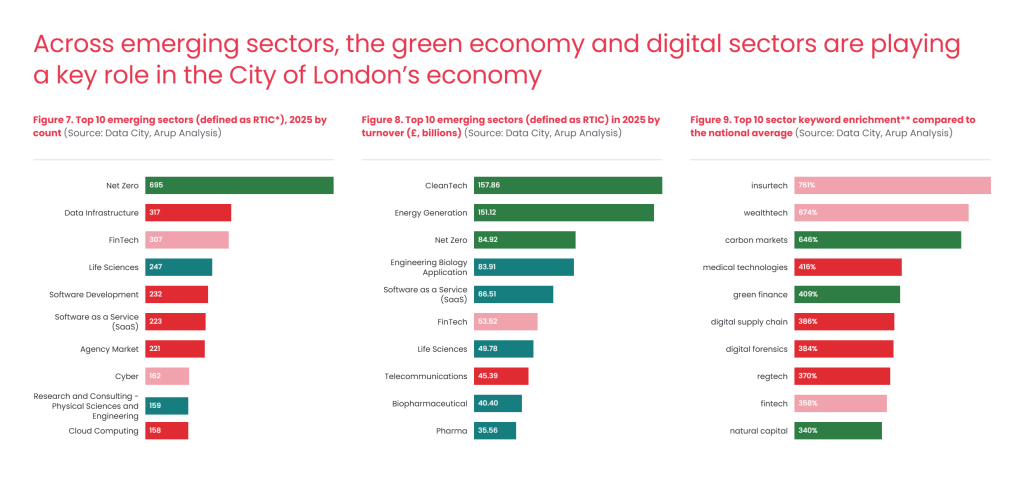
In the Economic Baseline analysis, this approach enabled the identification of areas where the City Corporation was leading in Innovation activities such as Data Infrastructure firms, FinTech companies, Net Zero, and businesses operating within the city’s boundaries. It also supported a detailed sectoral enrichment analysis, showing that specialisms such as InsurTech and WealthTech are significantly overrepresented in the city compared to the UK average, at more than seven and six times the national level respectively. This level of insight is not achievable using SIC codes alone.
RTICs were combined with traditional classifications to build a more complete picture of the city’s economy. This approach revealed a strong concentration of emerging green economy and technology sectors that are often difficult to identify using standard classifications alone. The analysis highlighted significant activity in Data Infrastructure, Software Development, SaaS, FinTech, Cyber and Cloud Computing, Net Zero, alongside established strengths in financial and professional services. Sector keyword enrichment analysis further demonstrated the city’s specialisation in areas such as InsurTech, WealthTech, Green Finance, Carbon Markets and RegTech, reinforcing its position as a centre for both financial innovation and the transition to a greener economy.
To understand employment patterns, the study also used our modelled employment estimates at company level. These are derived from available corporate filings and additional data signals, providing a consistent and scalable view of headcount across the economy.
What our data enables
This project demonstrates the type of analysis that becomes possible when detailed, real-time company data is combined with RTICs.
By moving beyond static industrial classifications, our data allows organisations to explore how economic activity is actually distributed across geographic locations, not just by sector labels, but by how businesses cluster, evolve, and relate to one another in real time.
RTICs make it possible to identify emerging and fast-moving areas of the economy that are often invisible in traditional datasets. This includes sectors that sit across multiple classifications or fall outside them entirely and enables a more accurate understanding of how modern industries are structured at a granular level.
When combined with spatial analysis techniques, this approach supports a much more dynamic view of economic geography. It allows users to move beyond broad sector groupings and instead examine how different types of activity concentrate, overlap, and interact within specific locations. In practice, this means analysts can explore everything from highly centralised industry clusters to more distributed, multi-nodal sector structures and do so using consistent, up-to-date data on real operating businesses.
This is the difference between describing the economy using legacy classifications and observing it as it actually exists today.
Why this type of work matters
This project demonstrates what becomes possible when real-time economic data is combined with advanced spatial analysis.
Arup brought the economic framework, spatial methodology, and analytical depth. The Data City provided the granular, company-level data infrastructure that enabled detailed sectoral mapping at street level. Together, this allowed for a more dynamic understanding of one of the world’s most important business districts. The findings will support the City Corporation, in shaping strategic and operational decision-making across the Square Mile, helping ensure the city remains competitive on a global stage
This type of work reflects a growing demand for more accurate, real-time views of the economy, particularly in complex urban environments where traditional classifications are no longer sufficient.
Our platform is designed for exactly this kind of challenge. Whether supporting consultancies, government, local authorities, or research institutions, we provide the granular economic data and classification systems needed to understand how modern economies are actually structured.
If you are working on similar challenges and want to explore how our data and RTICs could support your analysis or strategy, we would be happy to talk. Get in touch with us, or sign up for a free trial.