





The University Industry Impact Explorer (UIIE) already shows you your institution’s connections to industry: every spinout, research collaboration, Innovate UK partnership and alumni director, mapped and classified against the IS-8. Read more about the UIIE
But spinouts and grants only tell you about the companies your university works with directly. They say nothing about the thousands of people who leave with a degree and go and work somewhere else. Graduate Flows, a new feature on the UIIE, answers that question: which companies employ your graduates, in which sectors, and in which parts of the country.
What it’s built from
Graduate Flows uses Lightcast profile data, which records where someone studied and where they work now. We keep graduates of the universities we cover whose current employer is a UK company we can match to Companies House, and count each graduate once, against that employer. Someone who graduated from two of our universities is counted for both.
“Recent” means graduating between 2021 and 2026. This is a live snapshot of where people work today, not an official graduate destinations survey, so don’t expect it to line up exactly with HESA or Graduate Outcomes figures.
Two Charts, Two Different Counts
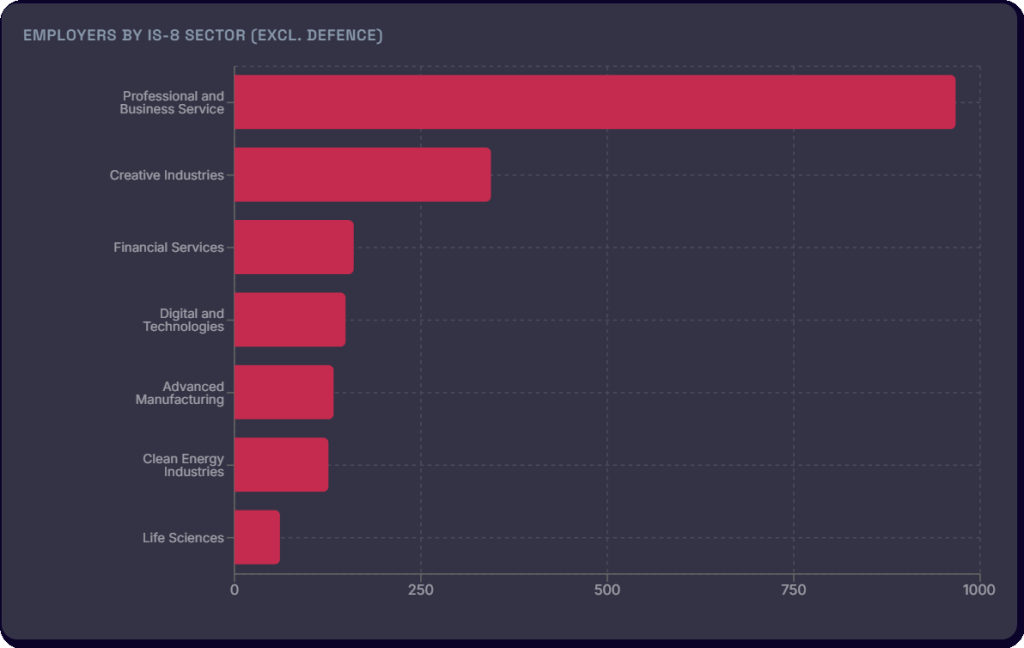
Employers by IS-8 sector
Counts companies, not people, and leaves out Defence. It shows which IS-8 sectors your graduates’ employers sit in, so you can see where your alumni base clusters.
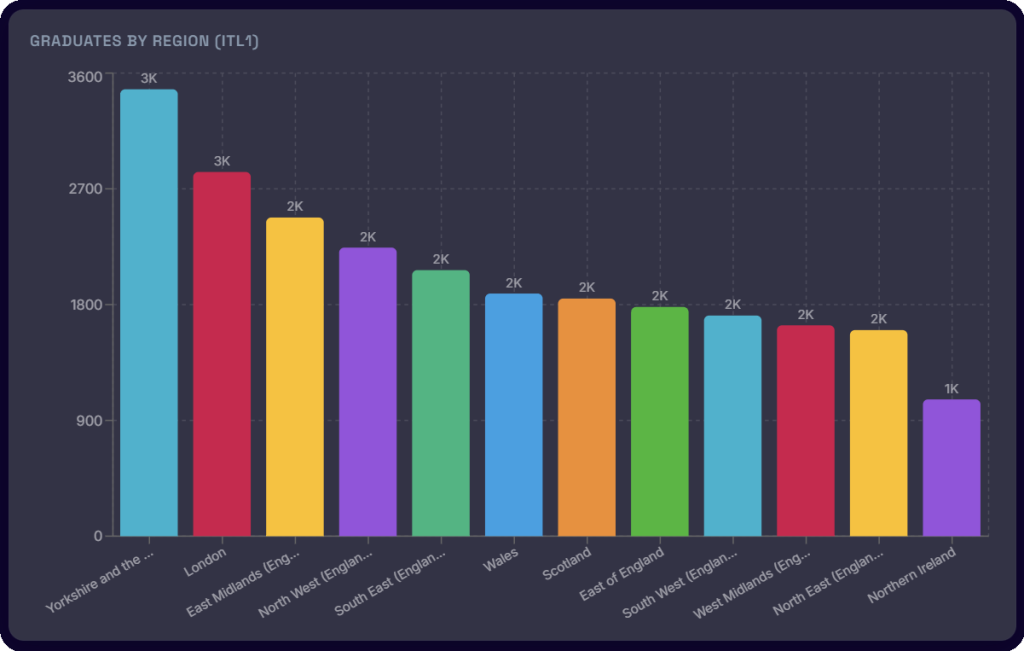
Graduates by region
Counts people, placed by where their employer has offices. A graduate whose employer has offices in more than one region is counted in each of those regions. That’s intentional, but it means the regional bars can add up to more than your total graduate count. Don’t read them as a breakdown that sums to 100%.
Take Sheffield Hallam. Professional and Business Services and Creative Industries are its two largest employer sectors by a wide margin. Regionally, Yorkshire and the Humber and London take the largest national shares, while South Yorkshire and West Yorkshire lead the more local, strategic-authority view: a university retaining talent close to home while still feeding London’s graduate market.
What’s under-counted
We can’t count anyone Lightcast has no profile for, or anyone whose employer isn’t a UK-registered company we’ve matched, which rules out the public sector, overseas employers, and the self-employed. For Sheffield Hallam, 503 graduates fall into this gap: left out of the regional charts but still included in the totals and the IS-8 sector view.
This is a view of graduates working for matchable UK companies, which is exactly the group a knowledge exchange team can build a relationship with, or a careers service can point students toward.
Why this is useful
For HEIF and REF-adjacent reporting, Graduate Flows gives you a defensible answer to “where do your graduates go, and are they going into IS-8 sectors?” For careers teams, it’s a live map of who’s hiring your alumni, by region and by growth sector, to target the next round of employer outreach. For business development, it’s a way to check whether your graduate pipeline into a sector matches your spinout and research activity in that same sector.
See it on your own institution
Graduate Flows is available now inside the UIIE, alongside the Dashboard, Leaderboard and Industrial Strategy views.
Start a free trial or book a demo to see your institution’s own Graduate Flows charts.
The University Industry Impact Explorer (UIIE) is The Data City’s product for universities, mapping every connection your institution has with industry, from spinouts and research collaborations to Innovate UK partnerships and alumni directorships, and classifying it all against the UK Government’s IS-8 priority sectors.
This article looks at a new tool inside the platform, Opportunity Finder. It’s built for teams doing outreach on behalf of a university, such as business development and knowledge exchange, to help them find new prospects and companies to engage with.
But a map on its own doesn’t fill a science park, win a knowledge transfer partnership (KTP), or get a business development team on the phone to the right company. It shows you where you stand, not who to approach next.
That’s what the Opportunity Finder is for. It takes the same ecosystem data and turns it into four ranked, filterable prospect lists, which are built around the outreach decisions a university actually has to make, not just the relationships it already has.
Four ways to find your next connection
The Opportunity Finder sits inside the Explorer and gives you four distinct views onto the same underlying company data; each built for a different kind of outreach:
- Regional Poaching: These are the companies near to your university already working with other universities
- Sector Untapped: These are the fast-growing companies in a sector you choose, with no university relationship at all.
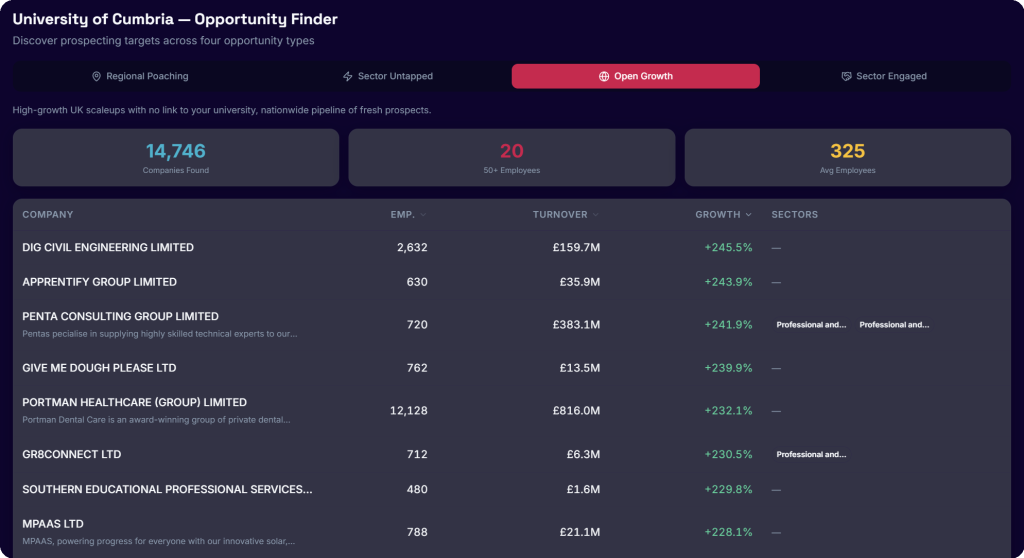
- Open Growth: These are the fastest-growing companies in the UK with no link to your institution, regardless of sector or location.
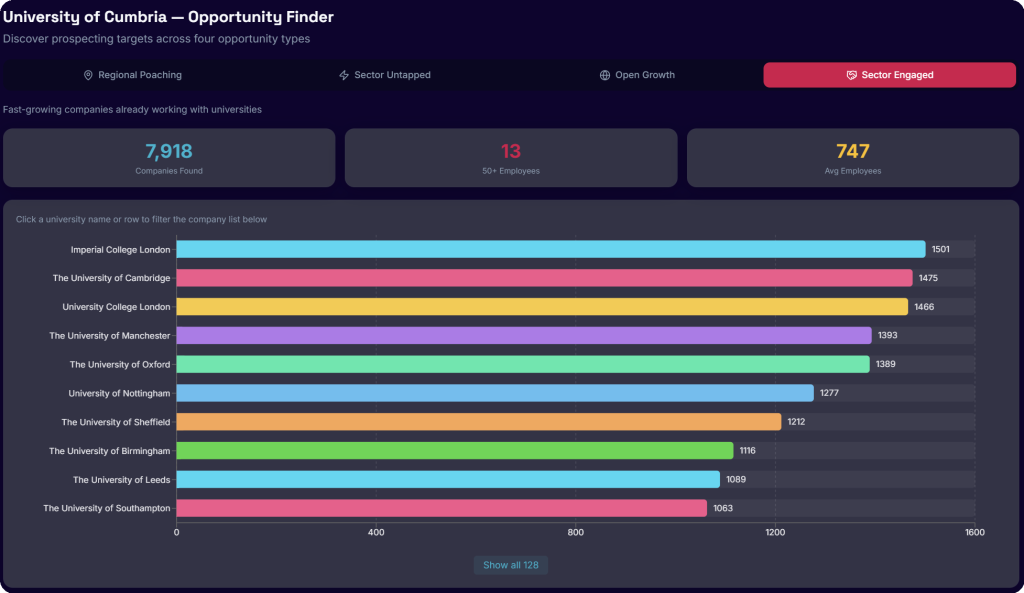
- Sector Engaged: These are the companies already collaborating with universities in a sector you choose, so you can see who the competition for that sector actually is
Each view is a live, ranked table you can filter and easily sort.
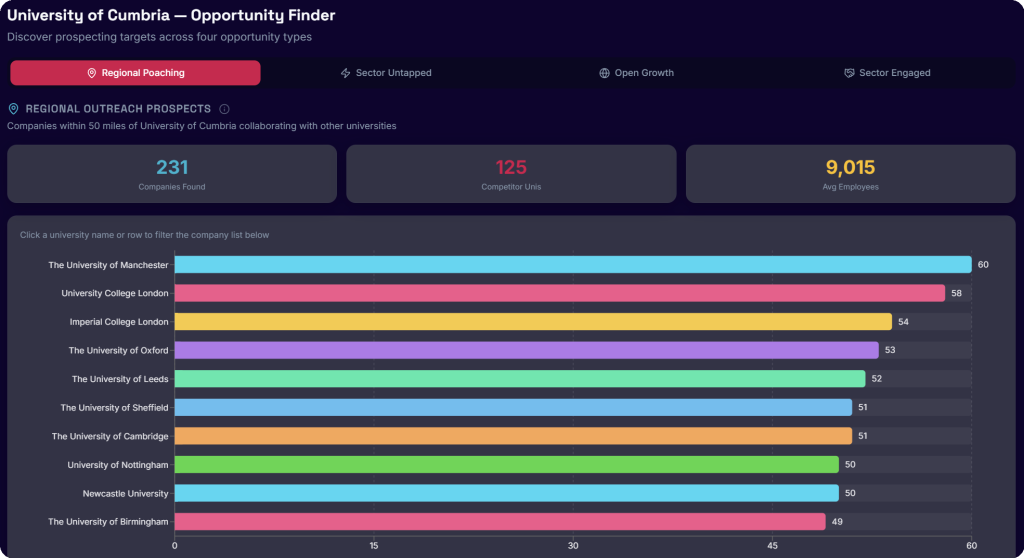
Regional Poaching
This view shows you companies within 50 miles of your university that already have a formal relationship with a different institution, whether that’s a spinout link, a research collaboration or an Innovate UK partnership, but not with yours.
That combination matters more than it sounds. A company in this list is close enough to work with practically, and it has already shown it’s willing to collaborate with other universities. That’s a much easier conversation to open than a cold approach to a company with no track record of academic partnership at all.
The data comes from The Data City’s API for the geographic filtering, cross-referenced against our university relationship database for the collaboration history. We only count substantive research or commercial relationships here. A shared alumnus sitting on a company’s board isn’t treated as evidence of institutional collaboration, so alumni-only connections are excluded from this view.
Sector Untapped
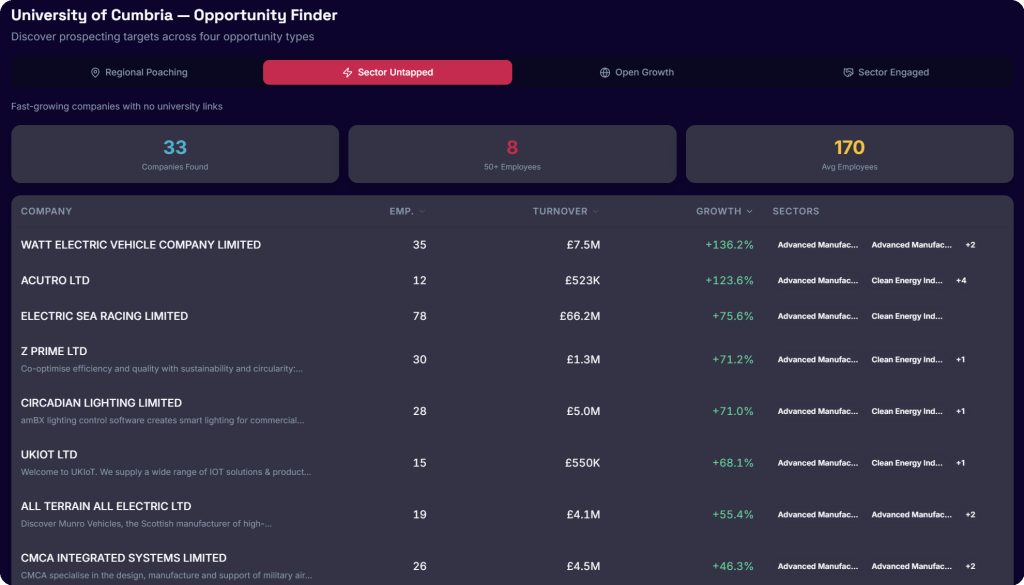
Pick a Real-Time Industry Classification (RTIC), such as Advanced Manufacturing, or Clean Energy, and Sector Untapped shows you the fastest-growing companies operating in it that have no university relationship at all. No spinout link, no research collaboration, no Innovate UK partnership, with anyone.
This is where the Explorer’s IS-8 classification earns its keep. SIC codes can’t reliably surface a sector like this in the first place; Real-Time Sic Codes (RSICs) and RTICs can. So, the list you get back is a genuine, ranked pipeline of high-growth companies in a sector your institution already has a reason to care about – sized, sorted by growth, and entirely unclaimed by any competitor institution.
For a business development or research team building a case for outreach in a specific specialism, this is the difference between “we think there’s opportunity in this sector” and a named list of companies to start calling.
Open Growth
Open Growth drops the sector filter and the regional filter and shows you the UK’s fastest-growing companies, full stop, with no existing link to your university. It’s a nationwide view rather than a local one, and it’s sector-agnostic rather than specialism-led.
Where Sector Untapped is about depth in something you already do, Open Growth is about breadth: a pipeline of high-growth prospects you might not have found any other way, because they sit outside your usual geography or your usual sector focus. It’s the view to use when you want to know what you might be missing, not just what you already expect to find.
Sector Engaged
Sector Engaged flips the question around. Choose a sector, and it shows you fast-growing companies that already have a university relationship, so you can see which institutions are active in that space, and which companies have already chosen to collaborate with someone else.
This isn’t just competitive intelligence. A company already engaged with another university has demonstrated it values academic collaboration and it’s a proof point, not a dead end. Where a company has more than one relationship, that’s often the strongest signal of all: it shows the door is open to working with more than one institution at once.
Built for the conversations that need to happen
Each view maps onto a real outreach decision your business development, research or knowledge exchange team makes every week. Opportunity Finder means you’re working from a ranked, current list instead of a hunch
See it on your own institution
Opportunity Finder is available now inside the UIIE, alongside the Dashboard, Leaderboard and Industrial Strategy views.
Start a free trial or book a demo to see your institution’s own Opportunity Finder lists.
The City of London Corporation commissioned Arup to deliver a spatial economic analysis of the Square Mile, to help the City of London’s Corporation better understand the economic dynamics within its boundaries and secure their future competitive position.
Analysing a place as economically dense as the city demanded more granularity and foresight than traditional datasets could offer. To fully respond to the brief, Arup needed additional insight and data resolution that enabled businesses to be identified and classified at street level, while also capturing emerging sectors that sit outside Standard Industrial Classifications (SIC).
That is where we were brought in.
We supported the analysis with granular, real-time company-level data and our Real-Time Industrial Classifications (RTICs), enabling a much more detailed view of the city’s business ecosystem than is possible using conventional datasets alone.
The result is a major spatial economic study of the Square Mile, mapping the city’s business base and identifying spatial clusters across key sectors including finance and insurance, legal services, technology, professional services, the built environment, and the creative industries, as well as their emerging sub-sectors such as FinTech and AI. The outputs will support the City Corporation in shaping the strategic future of one of the world’s most important economic centres.
We are proud to have supported this work alongside Arup.

The need for novel data
Understanding a place as economically dense and complex as the City of London requires a far finer level of resolution than official statistics can typically provide.
A key limitation of traditional datasets is that they often struggle to distinguish between businesses that are simply registered in a specific area and those that are actually operating there. Considering the incredible attractiveness of the city of London’s postcodes for businesses that seek prestige and recognisable addresses, any analysis that did not distinguish between the two risked to provide a skewed picture of the city’s local business base.
Traditional classifications also have limited ability to capture emerging and fast-moving sectors such as FinTech, Cyber, Net Zero, PropTech, and Artificial Intelligence, which cut across multiple Standard Industrial Classification (SIC) codes or are not well represented within them.
This is exactly the gap that our Real-Time Industrial Classifications (RTICs) were designed to solve.
Where our data came in
Across the sectoral analysis, Arup drew on The Data City platform to identify, classify, and map businesses across the city and its surrounding area. Each of the sector cluster maps in the analysis, from financial services and insurance to cloud computing, PropTech, and digital creative industries is underpinned by our company-level dataset.
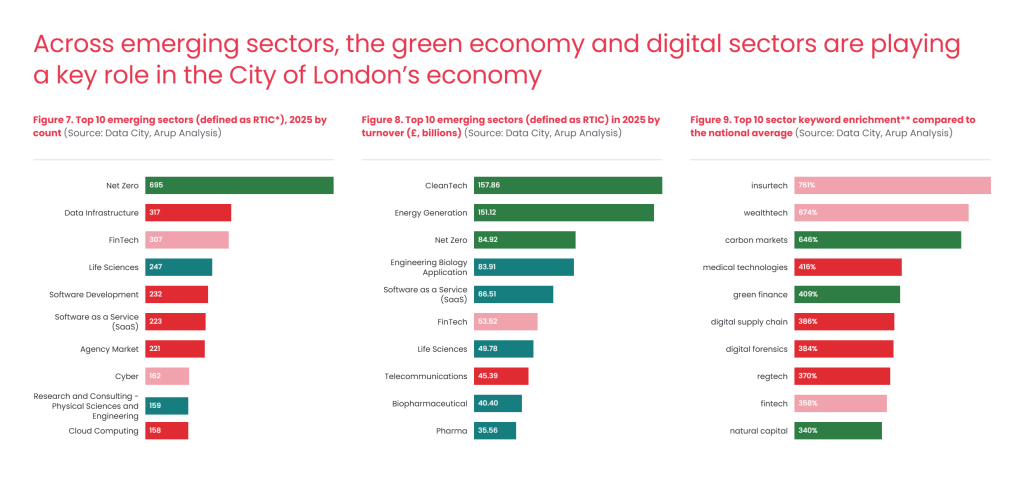
In the Economic Baseline analysis, this approach enabled the identification of areas where the City Corporation was leading in Innovation activities such as Data Infrastructure firms, FinTech companies, Net Zero, and businesses operating within the city’s boundaries. It also supported a detailed sectoral enrichment analysis, showing that specialisms such as InsurTech and WealthTech are significantly overrepresented in the city compared to the UK average, at more than seven and six times the national level respectively. This level of insight is not achievable using SIC codes alone.
RTICs were combined with traditional classifications to build a more complete picture of the city’s economy. This approach revealed a strong concentration of emerging green economy and technology sectors that are often difficult to identify using standard classifications alone. The analysis highlighted significant activity in Data Infrastructure, Software Development, SaaS, FinTech, Cyber and Cloud Computing, Net Zero, alongside established strengths in financial and professional services. Sector keyword enrichment analysis further demonstrated the city’s specialisation in areas such as InsurTech, WealthTech, Green Finance, Carbon Markets and RegTech, reinforcing its position as a centre for both financial innovation and the transition to a greener economy.
To understand employment patterns, the study also used our modelled employment estimates at company level. These are derived from available corporate filings and additional data signals, providing a consistent and scalable view of headcount across the economy.
What our data enables
This project demonstrates the type of analysis that becomes possible when detailed, real-time company data is combined with RTICs.
By moving beyond static industrial classifications, our data allows organisations to explore how economic activity is actually distributed across geographic locations, not just by sector labels, but by how businesses cluster, evolve, and relate to one another in real time.
RTICs make it possible to identify emerging and fast-moving areas of the economy that are often invisible in traditional datasets. This includes sectors that sit across multiple classifications or fall outside them entirely and enables a more accurate understanding of how modern industries are structured at a granular level.
When combined with spatial analysis techniques, this approach supports a much more dynamic view of economic geography. It allows users to move beyond broad sector groupings and instead examine how different types of activity concentrate, overlap, and interact within specific locations. In practice, this means analysts can explore everything from highly centralised industry clusters to more distributed, multi-nodal sector structures and do so using consistent, up-to-date data on real operating businesses.
This is the difference between describing the economy using legacy classifications and observing it as it actually exists today.
Why this type of work matters
This project demonstrates what becomes possible when real-time economic data is combined with advanced spatial analysis.
Arup brought the economic framework, spatial methodology, and analytical depth. The Data City provided the granular, company-level data infrastructure that enabled detailed sectoral mapping at street level. Together, this allowed for a more dynamic understanding of one of the world’s most important business districts. The findings will support the City Corporation, in shaping strategic and operational decision-making across the Square Mile, helping ensure the city remains competitive on a global stage
This type of work reflects a growing demand for more accurate, real-time views of the economy, particularly in complex urban environments where traditional classifications are no longer sufficient.
Our platform is designed for exactly this kind of challenge. Whether supporting consultancies, government, local authorities, or research institutions, we provide the granular economic data and classification systems needed to understand how modern economies are actually structured.
If you are working on similar challenges and want to explore how our data and RTICs could support your analysis or strategy, we would be happy to talk. Get in touch with us, or sign up for a free trial.
Harini Nagesh Data Analyst
Harini’s undergraduate degree was in Economics (BA) from India. She recently graduated from the University of Leeds in economics (MSc). As a data analyst, she works on and with the data, ensuring the quality whilst understanding customers’ needs to drive improvements in the product.

With her academic knowledge on working with large data sets Harini aims to bring forward her skills of understanding and simplifying complex data at The Data City. Apart from being an analyst she is also an Indian classical dancer.
Sam Jessop Industry Analyst
Sam is an economist and data analyst at The Data City, combining global academic experience with hands-on skills in tools like Tableau and Jupyter to shape accurate economic classifications and tell data-driven stories.


Sam holds a BA in Economics from Nottingham Trent University. He was awarded two scholarships to study abroad: one at the Hong Kong Polytechnic University, where he focused on Global Economics, and another at I-Shou University in Taiwan, where he studied traditional Mandarin.
He has been mentored by an industry expert to sharpen his analytical skills, particularly through the use of industry-standard tools such as Tableau and Jupyter Notebook. This experience helped him build a portfolio of insightful projects — including an analysis of Oscar Piastri’s Formula 1 debut season compared to some of the sport’s all-time greats. These experiences have shaped Sam into an analyst with a truly global perspective on industries and the economies they operate within.
Responsibilities at The Data City
At The Data City, Sam works directly with data to classify economic sectors through the company’s Real-Time Industrial Classifications (RTICs). He updates and reviews existing classifications to ensure that the most accurate and up-to-date view of the economy is reflected in the data.
Sam also contributes to writing compelling blog posts that demonstrate the power of The Data City’s tools and uncover the unique stories that the data reveals.
George Udale Industry Analyst
As an industry analyst, George blends skills in creative storytelling with analytical precision to translate complex data into clear, engaging industry insights.

George holds a first-class BA in English Literature from the University of York, where his research explored the intersection of artificial intelligence and poetry.
George is also about to graduate with an MSc in Consumer Analytics and Marketing Strategy from the University of Leeds, where he has applied machine learning programs and agent-based models to study retail strategy.
His applied dissertation, completed with a Nepalese fintech company, focuses on developing a new pricing and communication strategy to make loans more accessible for smallholder farmers and to improve financial inclusivity in Nepal’s rural areas.
Outside of studies, George enjoys DJing and has written articles exploring how mobile phone use in clubs is changing the connection between DJs and the dancefloor.