What are the UK’s industrial strengths?
What new strengths are emerging or likely to emerge?
Where are those current strengths and potential strengths located?
The answers to those three questions matter for people wanting to start and expand businesses, for businesses looking for customers, suppliers, and collaborators, and for universities and research institutes looking for partners to commercialise inventions. The answers also matter for any government looking to support economic growth with investments in research, infrastructure, housing, and training.
National data, local knowledge, and intuition.
Today we answer these questions using two main sources of information.
We use local knowledge, and we use national data on the economy.
The national data is mostly open data from the ONS. Sometimes government uses its own database based on tax collection and other data sources.
The local knowledge is distributed across the private sector and often represented by trade bodies. Local knowledge in the public sector is mostly held by economic development teams in local authorities, LEPs, and devolved government.
These sources of information are often combined in centralised national organisations such as UKRI and The UK Government and its departments who make decisions on which industries to support, in what ways, and in what places.
This system works surprisingly well. The UK has world-leading clusters of industrial success in finance, most notably in London and Edinburgh, in pharmaceuticals and bioscience, most notably in Oxford and Cambridge and in vehicle assembly, most notably in Sunderland. All have received large government support which has supported and maintained their success. There are many important clusters of the economy which are not world-leading, but no less important because of that.
Many people think that the system could work even better, in part because our economic outcomes are quite poor. The UK economy remains the weakest in Northern Europe and North America. Regional inequality of GDP within the UK is unusually high.
We know that national statistics, tied to outdated industrial classifications like the SIC code, have large flaws that are probably impossible to fix. We know that local knowledge often lacks national and international context and misses emerging strengths. We also know that local knowledge tends to “chase the money”, with local strengths too often conveniently identified to align with known focuses of national investment. And we know that national knowledge too often ignores local knowledge and focuses on a few large national strengths which are politically important alongside a widely dispersed and non-specific “investing in prosperity everywhere” approach for other sectors.
Identification of industrial strengths in the UK with more data and less feeling.
Here are two ways that we can do better. We have been working on this for the past few months at The Data City.
First, we rely on how businesses describe what they do, not by the SIC code that they picked when they registered their company but by what they say they do on their websites. We can do this using our RTICs, powered by machine-learning and large expert-curated training sets, or by using the simpler method of keyword analysis. Either way, we have a stronger foundation for understanding the industrial strengths of a place.
Second, we reduce the amount of intuition and feeling that goes into identifying industrial strengths. This means that emerging strengths are not ignored, it means that local areas do not all claim to be world-leading in the same leading field, and it means that national policymakers do not have to know everything about every part of the UK in order to make national policy.
Keyword over-concentration on the websites of businesses in small areas.
The Data City’s database contains the registered and trading addresses and the websites and full website text of over 1 million UK companies. We search all these websites for the contents of a dictionary of about 1000 words and phrases such as “user experience”, “smart grid”, and “biosimilar” that cover a broad range of industries.
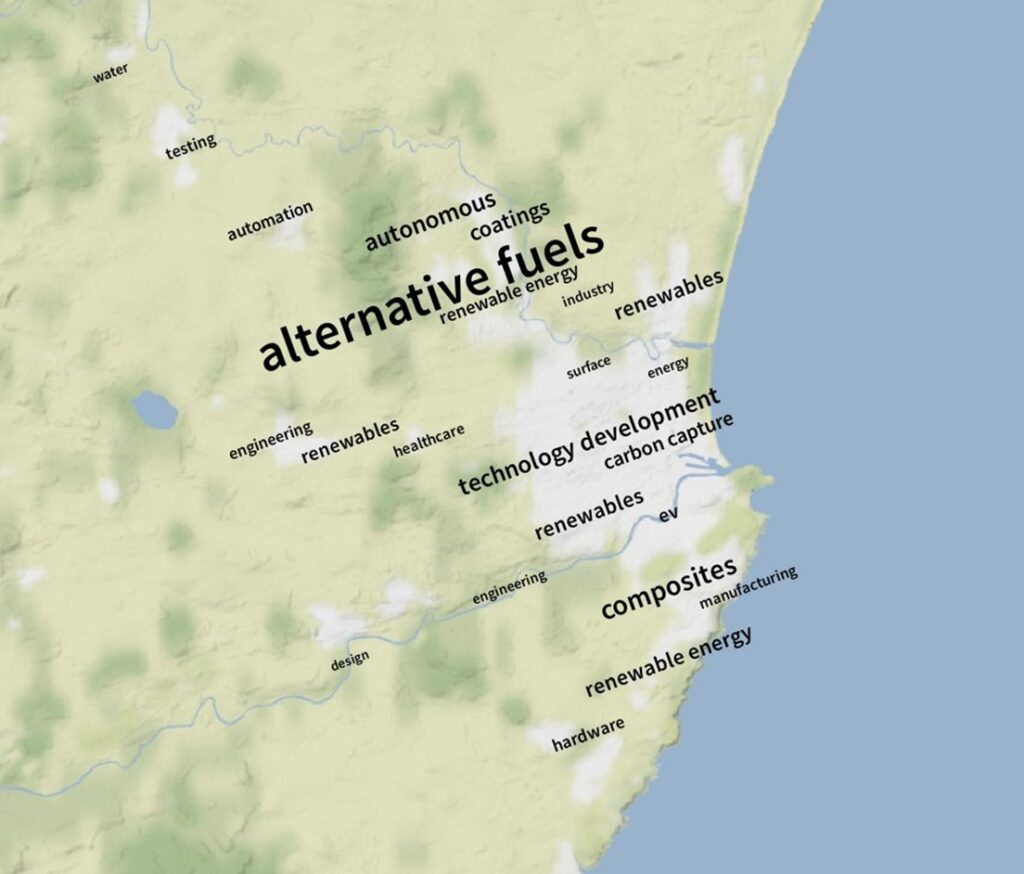
We split the UK into a grid of rectangles, in this case approximately 2km by 1km, and then count the number of businesses in that grid using each of the words and phrases on their website. By comparing the concentration of a word within each grid compared to the concentration of that word nationally we can identify, from first principles, the location of industrial clusters in the UK and then put them on a map.
Where a grid has no statistically significant over-concentration of a keyword no keyword is shown. The size of the keyword is proportional to its over-concentration.
The first results of this technique are extremely promising.
Aberdeen’s known strengths related to the offshore oil and gas industry and its successors are identified and located convincingly by keyword over-concentration.
Stoke-on-Trent’s known strengths in sports betting are identified and located convincingly by keyword over-concentration.
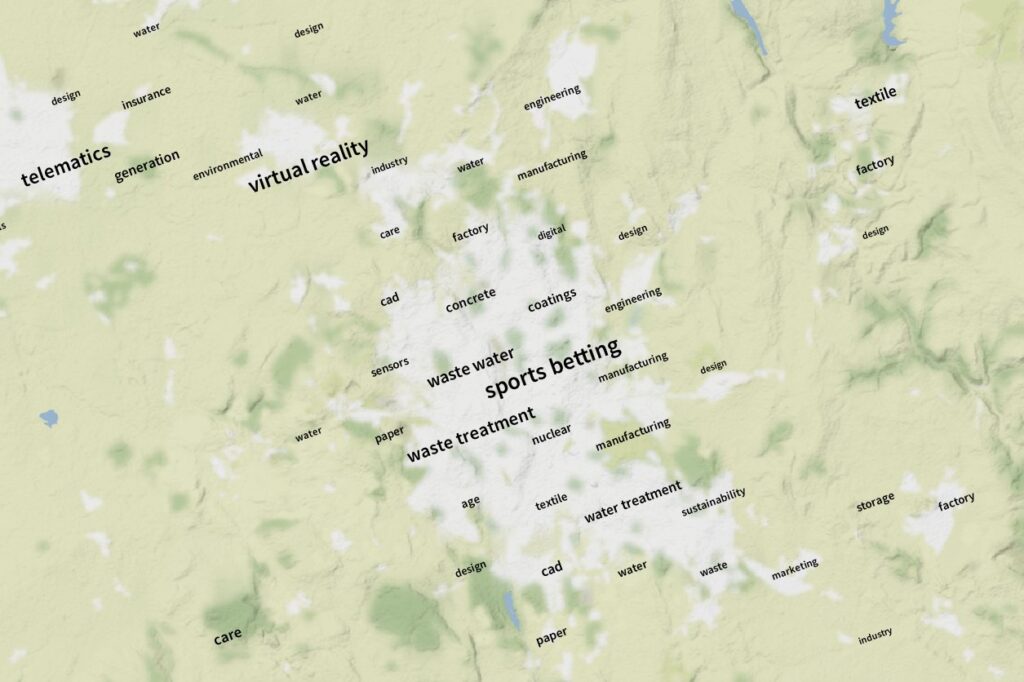
The early results from this method are extremely promising. It works well at different grid sizes and for the whole of the UK. We have maps that work well for small parts of central London and for the whole of Scotland. It identifies known strengths of areas. It correctly and importantly does not identify exceptional economic strength in most parts of the UK.
So what? What next?
We think that these and other methods are essential for doing industrial strategy better. They are a less biased and more objective foundation for discussions between local experts, national policymakers, international investors, and our elected politicians about industrial strengths right across the UK. We hope that they will improve those discussions.
But we know that there is a lot more to do, and we are already working on many improvements.
- We are assembling a larger dictionary of key words and phrases so that we can identify more strengths in more sectors in more places. For example, Stoke-on-Trent’s industrial strengths in ceramics are not identified because keywords related to these industries were not present in our dictionary.
- We are experimenting with not using a phrase dictionary at all and relying on over-concentration of phrases across the whole language (with place names and proxies for place names such as telephone dialling codes removed).
- We are experimenting with alternatives to grids as a way of splitting up the UK. Both circles and accessibility isolines are working well.
- We are exploring combining geographies at multiple scales (industrial specialisation in Salford occurs at a significant smaller geographical scale to in Cornwall) with some success.
- We are looking not just at the most over-concentrated word in a small geography but the top three or five most over-concentrated words.
- We are working to cluster similar words into a single theme so that clusters across that theme can be identified more easily.
- We are working on ways to let users explore the data for the whole of the UK in their web browser.
And much more.
We are also working on this problem from a completely different starting point using RTICs. But I’ll let Amanda tell you about that. Her blog post should be up next week.