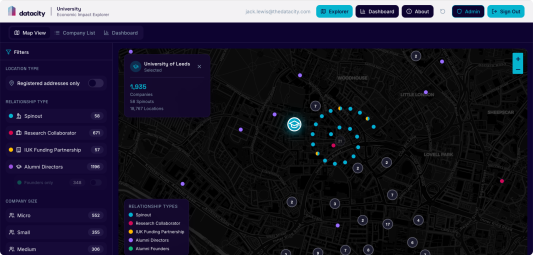
Over the summer we launched an improvement to our product called what companies do where. In summary, it helps you better understand where companies operate and what they do in specific locations.
We previously had this data for 547,000 companies, with a significant coverage of large companies, that have multiple locations. Over the last couple of months, we’ve been refining how we collect this data and we now have this information for 935,000 companies. Where we had data previously, we now have richer data too.
This means that for more companies we can better understand how many of their employees are based in the UK, compared with the rest of the world. This is powering improved estimates of UK employee counts on our platform. We can also better understand where in the UK their employees are located, and what occupations they are in.
With this improvement in matching, we are making a small change to how this data is presented.
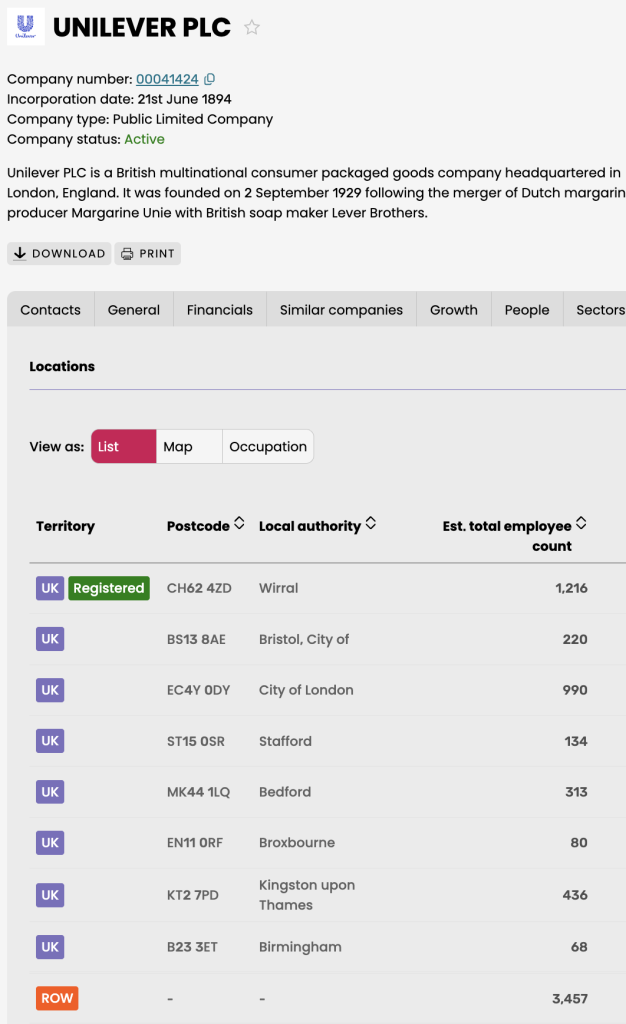
The screenshot below shows how this was presented before on a company page. Each of the numbers corresponded to how many Lightcast profiles were found in, or near, that location.
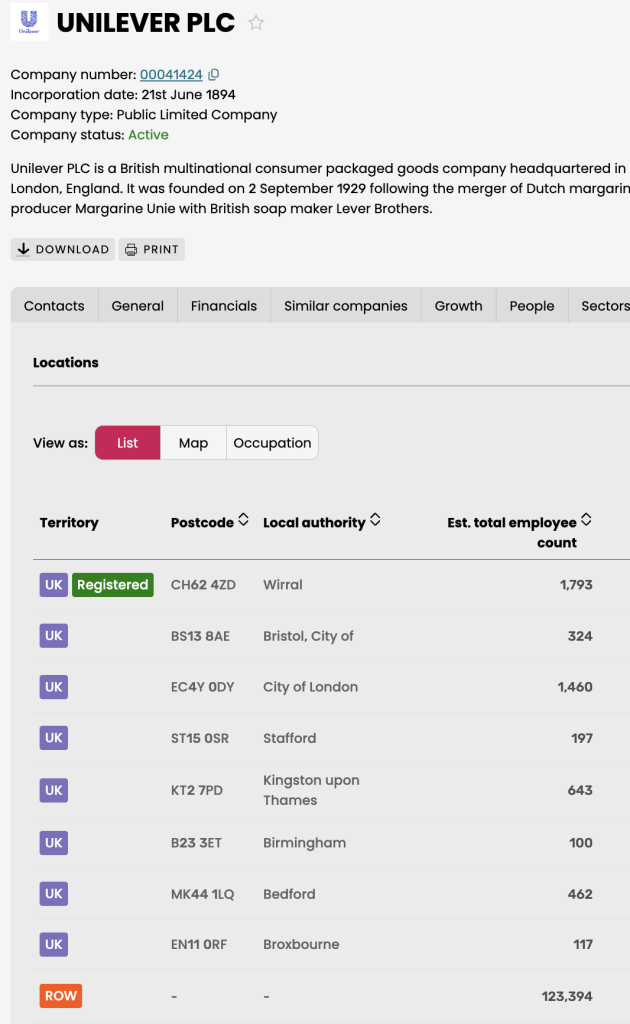
We’ve made a change, so that rather than being the number of profiles, it is now an estimate of the number of employees by location and occupation. This also brings consistency to data across a company’s page and on analyse.
We’re able to make this change because of the improvements to the amount of data we get for each company. In general, the number of profiles we have for each company is now more representative of its number of employees.
These updates are a great example of how we’re improving the clarity and usefulness of our data. By going beyond profiles and providing richer, more accurate estimates of employees by location and occupation, we’re helping our users understand not just what companies do, but where they do it, and what that really means for jobs, skills and investment.
Want to see it in action? Get in touch or log in to the platform and explore the data for yourself.