When we say a sector is growing, what do we really mean?
At The Data City, we think it’s vital to get under the hood of growth metrics – not just for the sake of precision, but because decisions rely on them.
In ANALYSE, our growth rate metric helps users compare how sectors and geographies are evolving over time. But raw numbers don’t always tell the full story.
In this blog, we break down exactly how we measure growth on ANALYSE. We’ll discuss why we’re refining our approach, and how our latest update makes those insights more accurate, fair and useful.
Whether you’re building investment cases, designing policy or benchmarking industries, you’ll want to know how our smarter growth metric gives you a better signal and less noise.
Measuring growth
Our growth rate on ANALYSE measures the long-term growth of the sector, based on the number of employees over time. We know it’s a helpful metric for comparing the performance of sectors and areas.
Before we measure growth, we consider which companies it is appropriate to measure the growth of.
In our latest release of the platform (v5.3), I’ve highlighted a significant change below (1.2) that improves our accuracy in measuring the growth of a sector. By excluding years with sparse data, we’re avoiding basing our growth calculation on potentially biased or incomplete samples. This leads to more representative and truthful results about sector growth.
How we calculate growth rate
Let’s take a look at our updated definition of growth in our platform.
1.1 We only look at companies that have reported at least 3 years of financial accounts. Specifically, we look at companies that have reported at least 3 years’ worth of employee data. There can be gaps in companies accounts. They may report for one year and then allow subsequent accounts to become overdue. Companies also report on different time frames. Because we have at least 3 years of reported financial account, we are able to fill in any gaps with projected values.
1.2 We make sure that the group of companies we’re measuring the growth of is as similar as possible, over time. Despite best efforts to fill gaps, some gaps do remain. We do not include years where only a small proportion of companies have data.
This approach helps mitigate the impact of outliers and keeps the approach as consistent as possible.
To measure growth, we then:
- Take the group of companies defined in 1.2 and sum their estimated employees in each year. As mentioned in 1.1, using estimated employees helps fill gaps.
- We take the logarithm of the value for each year. This is necessary to allow us to draw a line of best fit.
- Then we fit a line of best fit over this data, to find the average annual growth rate per year.
- We do not use turnover to measure growth due to a lack in data availability and the complications in accounting for inflation.
In short: we measure growth by calculating the average yearly change in estimated employee numbers for companies with at least three years of data, ensuring consistency by filling gaps where possible and excluding unreliable years.
Software Development (RTIC0079)
Let’s put this into perspective and use an example.
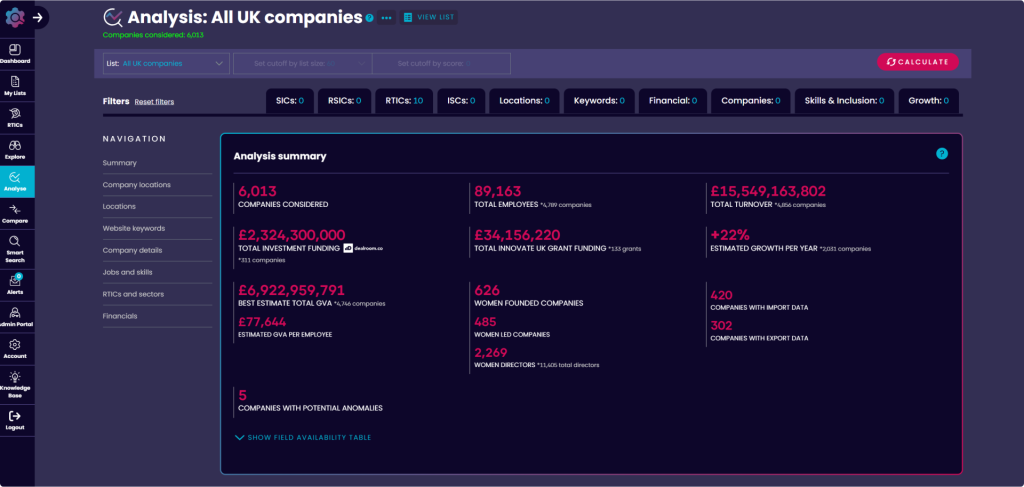
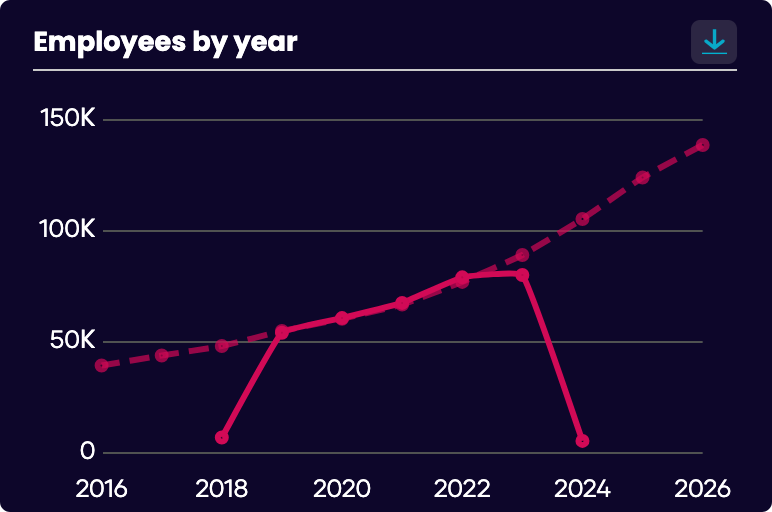
In ANALYSE, I’ve chosen the Real Time Industrial Classification ‘Software Development’ (RTIC0079). Before this update, we used to report the estimated growth per year of the sector was around 20%~. This is due to our method effectively plotting a line of best fit on the solid line on the “Employees By Year” chart:
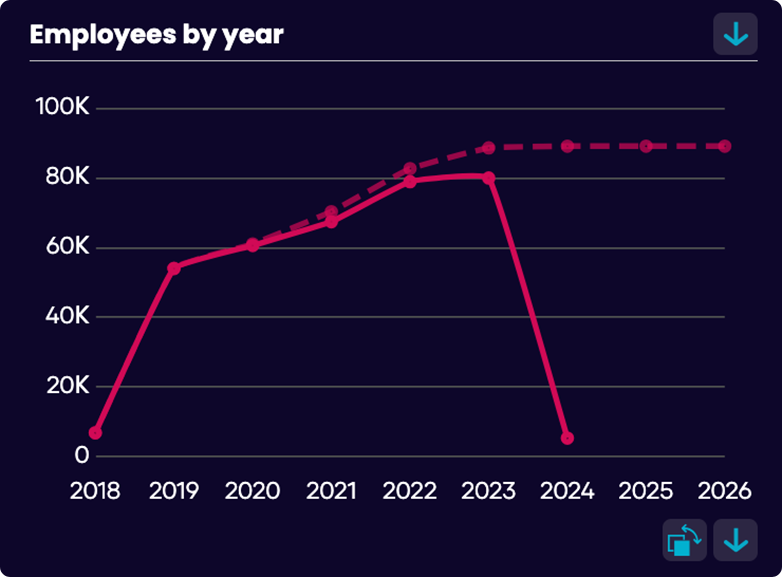
The solid line represents measured (reported to Companies House) values, and the dotted line represents our projections.
Obviously, this chart looks a little weird since we have large drop-offs in both 2018 and 2024 in our reported values (the solid line). So, what’s going on? If I switch to a bar chart and select the small help button (“?”), it becomes much clearer why we have these drop-offs:
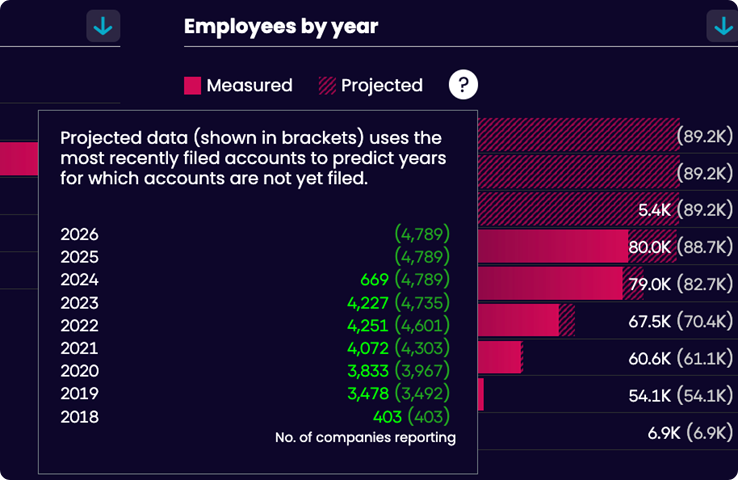
Since we receive the last six years of financials from our partners at CreditSafe, and it’s now 2025, the number of companies with reported employee figures for 2018 has significantly declined.
A different issue exists for 2024, many companies have yet to file their accounts, but the number reporting employee data remains low (due to the typical one-year delay in filings).
As noted in section 1.2, we’ve now chosen to exclude years where only a small proportion of companies have available data.
The improvement
After our update, below is how the same graph looks. Most of it is exactly the same.
To measure growth, we’re only plotting our line of best fit for the years 2019-2023. 2019-2023 are years where there are enough companies with values. This results in us reporting ~12% growth in the software development sector and we have a much smoother curve representing growth over time.
What this means for our users
This update may seem subtle, but it represents a major improvement in how we measure and communicate sector growth.
We’re being more selective about which years and companies we include in our analysis and therefore increasing the reliability of the insights we provide on ANALYSE.
In the case of ‘Software Development’ (RTIC0079), this change brings the estimated growth rate down from ~20% to a more realistic ~12%. That might sound like a downgrade, but in fact, it’s a more accurate reflection of what’s really happening in the software industry.
This refinement means you can trust that the growth rates you see are less influenced by reporting noise or data gaps, and more aligned with real trends in the economy.
Looking ahead
As we continue improving ANALYSE, we’ll keep refining our methodology to ensure that every number you see is both meaningful and dependable. We believe better data leads to better decisions.
Curious about our data? Sign up for a free trial today, or reach out to the team.