Find out what went into the building of the net zero classification, as well as some follow-up questions on the report.
We’ve partnered with the Energy & Climate Intelligence Unit (ECIU) and CBI Economics to create a groundbreaking report on the impact of net zero on the UK economy. In this article, we dive into the inner workings of our net zero classification, the backbone of the report.
Discover how we used cutting-edge technology and data to uncover the companies driving the net zero movement. From Low Carbon Renewable Energy Economy Surveys to Renewable Energy Planning Databases, we left no stone unturned in our quest for accuracy and transparency.

Our methodology
We used the Low Carbon Renewable Energy Economy Survey from the ONS as a guide for our methodology. While the ONS survey had the advantage of including information on things we cannot (such as imports and exports), it was limited to surveying only 24,000 companies. On the other hand, our approach allowed analysis of data from all the companies in our database (5.2 million), but with fewer company details. However, both methodologies had common data points like turnover, employee count, and capital investment.
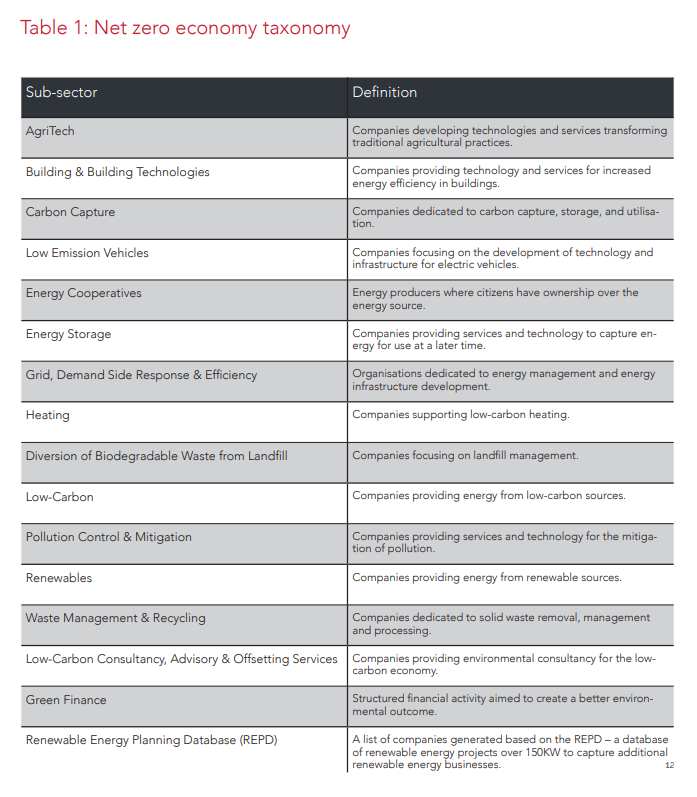
This survey also influenced the selection of industry sectors for our net zero classification. Although our mapping differs slightly from the ONS, the foundation for our verticals is taken from Table 2 of the survey. Our approach involved adapting the ONS’ verticals to fit our methods, which may result in slight differences, but helped with compatibility with our machine learning platform.
We also used the Renewable Energy Planning Database to train a specific vertical and reduce personal bias in the list-building process. Some parts of net zero can be quite contentious, so reducing personal bias was very important to us since our methodology for our RTICs relies on supervised machine learning.

Manual changes
Whilst our AI-platform provides an accurate view of a specific sector or economy, manual checks and QA changes from our team of experts are a key part of our classification process.
For example, for our net zero classification, our team manually removed Shell and NatWest (among others) from the net zero list as they don’t qualify as net zero companies, despite constant mentions of low carbon and renewable energy on their website. Manual exclusions such as this are very easy for us to do and were important in ensuring the accuracy of the classification.
Adding excluded companies back into the training set can be done in just 10 seconds with Data Explorer which is a far cry from traditional analysis methods that could take days or even weeks. Data Explorer’s flexibility allows for ongoing data querying so you can always come back to the data to analyse it in different ways. We think that this provides a huge benefit, especially when analysing contentious areas such as net zero, as it allows analysis to be done on many different levels.
Follow-up questions
- One hot topic in the net zero world is the inclusion of nuclear energy. To avoid bias, we made the decision to exclude it in consultation with our partners. Nuclear energy is something we can map on our platform though, so this is something we could do if there was interest.
- We also got asked if we can predict future net zero clusters. Identifying current clusters is a big challenge, so predicting future ones would be extremely difficult however we’re currently engaged in some large cluster analysis projects!
- Another area of interest is regional investment flows, which we hope to investigate in the future using multiple sources of funding data.
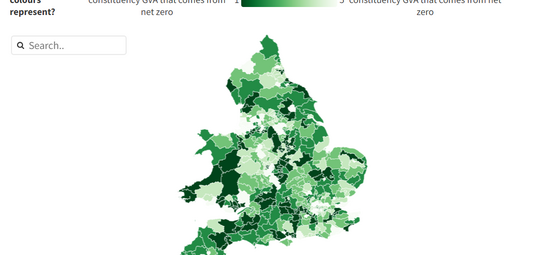
- And finally, pairing net zero hotspots with trade-vulnerable areas is something that is possible, but is best suited for experts with a deeper understanding of said areas.
You can download the full report from free direct from our reports section today. Want to talk more about net zero or our RTICs? Get in touch today and we’ll set up a call as soon as possible.


