Which places excel in terms of having concentrations in the key eight sectors (IS-8) the Government identified in its Industrial Strategy? It’s a question many places across the country are asking themselves as they adjust their plans to align with the national Industrial Strategy.
The Data City is the only source of a workable definition of the IS-8. The below uses this data to show both where in the country the IS-8 locates, and what this means for both local and national policymakers looking to turn the Industrial Strategy from a plan into action.
1. The IS-8 sectors cluster in certain parts of the country
Some places are more clearly hotbeds of IS-8 activity than others.
Figure 1 shows both the specialism (measured by location quotient – a measure of how many more businesses in any one sector a place has over the national average) and the size of the sector (size of the bubble) for each ITL2 area in the UK.
Figure 1: Some places have a much greater relative concentrations of the IS-8 sectors than others
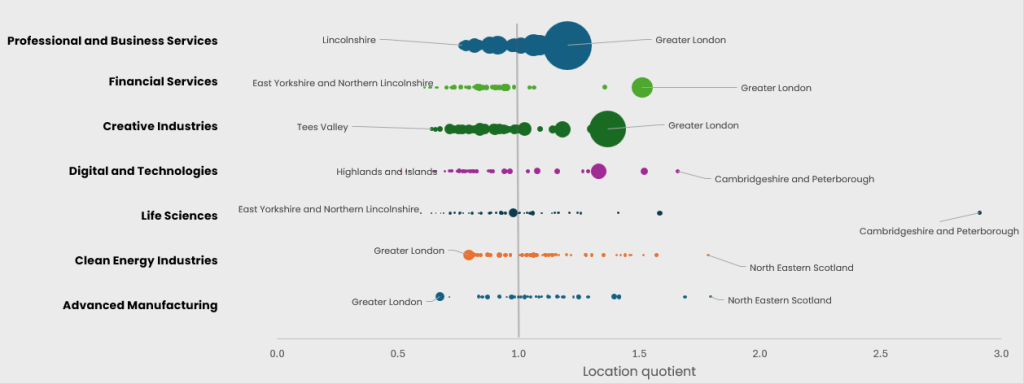
It shows that:
- Cambridgeshire and Peterborough has almost three times as many companies in Life Sciences relative to its share of all businesses, considerably higher than second-placed Buckinghamshire, Berkshire and Oxfordshire. It also has the highest concentration of digital and technologies.
- Greater London has the largest concentration of Finance, Creative Industries and Professional and Business Services companies.
- North Eastern Scotland (Aberdeen and its surrounding areas) have the highest relative specialism in Advanced Manufacturing and Clean Energy Industries.
2. Looking at the sectors in isolation misses where they co-locate
But looking at these sectors in isolation misses a very important insight: where one sector clusters, others tend to cluster too.
Figure 2 shows that this is mainly the case for services activities, which all have a correlation coefficient of 0.6 or above with one another. This happens because of the requirement of these sectors for face-to-face interaction, which means they tend to be overrepresented in denser urban areas that can better facilitate these interactions.
The data also suggests that where a place has a specialism in Life Sciences, it is also likely to have a specialism in Digital and Technologies and Professional and Business Services.
Figure 2: The services element of the IS-8 tend to co-locate
| Advanced Manufacturing | Clean Energy Industries | Life Sciences | Creative Industries | Digital and Technologies | Financial Services | Professional and Business Services | |
| Advanced Manufacturing | 1.0 | 0.3 | 0.4 | 0.0 | 0.4 | -0.2 | 0.4 |
| Clean Energy Industries | 1.0 | 0.2 | 0.1 | 0.0 | -0.1 | 0.3 | |
| Life Sciences | 1.0 | 0.4 | 0.7 | 0.3 | 0.5 | ||
| Creative Industries | 1.0 | 0.6 | 0.7 | 0.8 | |||
| Digital and Technologies | 1.0 | 0.6 | 0.8 | ||||
| Financial Services | 1.0 | 0.6 | |||||
| Professional and Business Services | 1.0 |
Not only do these activities cluster between firms, they tend to cluster within firms too. 40 per cent of all companies that have operations in an IS-8 sector have activities in at least two of them. Sector crossovers don’t just happen between firms, but within them too.
It is for this reason that policy should be careful not to fixate too much on any one sector but to look at the underlying reasons as to why groups of sectors do (or don’t) locate in specific areas.
3. (Greater) Bristol and Edinburgh have a clean sweep of sector specialisms, but there are several IS-8 ‘not spots’ too
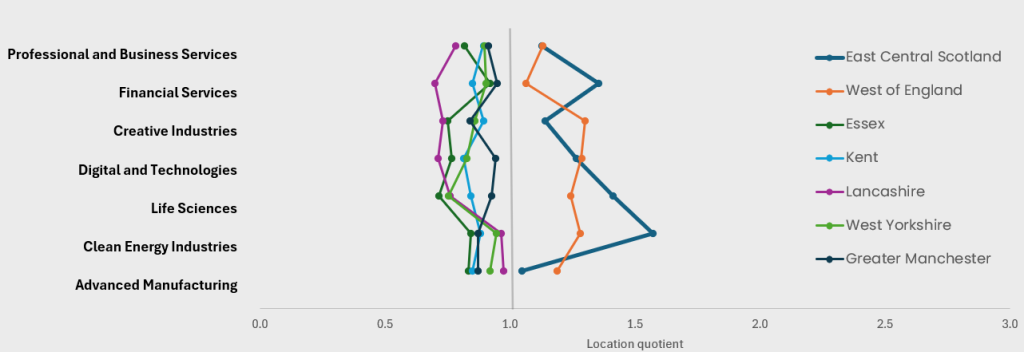
Bristol and Edinburgh and their surroundings have a specialism in all of the IS-8 sectors.
Figure 3 shows that they have a location quotient over 1 (meaning they outperform the national average) on each of the sectors, the only two places where this is the case.
In contrast, there are five places that don’t have a specialism in any sector. Kent, Essex, Lancashire, Greater Manchester and West Yorkshire score below 1 for each of the IS-8.
Figure 3: Edinburgh and Bristol (and their respective hinterlands) are overrepresented in every IS-8 sector
4. Most big cities don’t do particularly well
With the exception of London and Bristol, big cities underwhelm. This is particularly the case for the biggest – Manchester (Greater Manchester) and Birmingham (West Midlands).
As shown above, Greater Manchester doesn’t score above 1 for a single sector, while the West Midlands’ overperformance of Advanced Manufacturing and underperformance on service-based sectors is more akin to a rural area than a large urban one.
This is a concern because the scale of both places – and how this means they inherently offer the face-to-face interaction that cutting-edge services companies require – should make them natural homes for the IS-8. That they aren’t is bad news for the Government as it attempts to grow these sectors, and is an issue it highlighted in the Industrial Strategy.
5. Large city centres are at least home to concentrations of the IS-8
There is though some better news for the UK’s Industrial Strategy when looking at a lower level of geography in both places (see Figure 4).
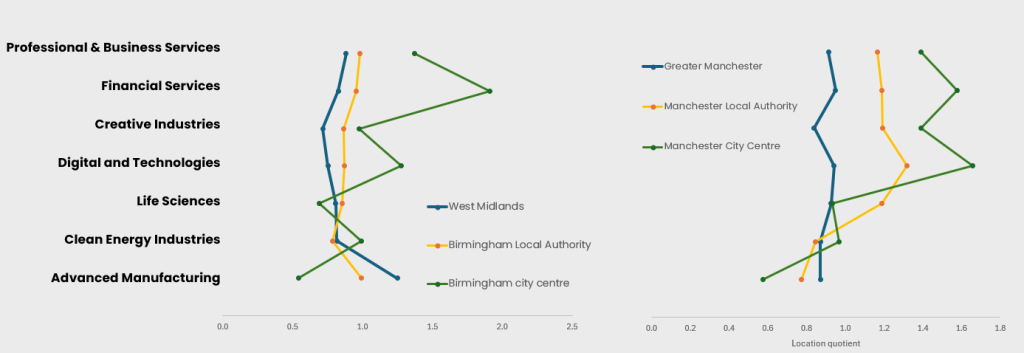
At the local authority level, Manchester does have location quotients above 1 across the services parts of the IS-8. Birmingham still performs relatively poorly though.
At the city centre level both places have stronger metrics. They both have clear relative specialisms in most of the service orientated IS-8 sectors, showing that their city centres do at least function as expected, even if at the city-region level they do not.
Figure 4: The city centres of Manchester and Birmingham have strong concentrations of service-focused IS-8 firms
6. But the national economy needs more from these city centres
At this point there is a line of argument that runs like this: ‘if the city centre is doing well, then the problem must be elsewhere in the city region.’
This is understandable. But it assumes that every part of a city region should be playing the same role in its economy, and so all parts should be performing at the same level.
The reality though is that different parts of a city region play different roles in its economy because they inherently offer different locational advantages. And so, what policymakers expect of different parts of it should vary too.
(If you don’t agree, consider the following: we wouldn’t expect rural mid Wales to have as many finance or business services companies as central London. The logic applies within a city region too.)
The issue for these city centres is two fold.
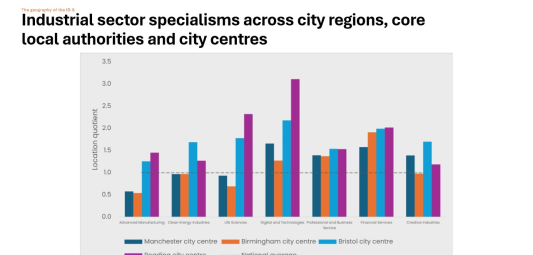
The first is that while their performance is stronger relative to their surrounding area, it is less good when compared to other city centres. Figure 5 shows that Birmingham and Manchester city centres have lower concentrations of most of the IS-8 sectors than each of Bristol, Reading and Brighton city centres.
Figure 5: Birmingham and Manchester city centres don’t do as well as those in Brighton and Reading
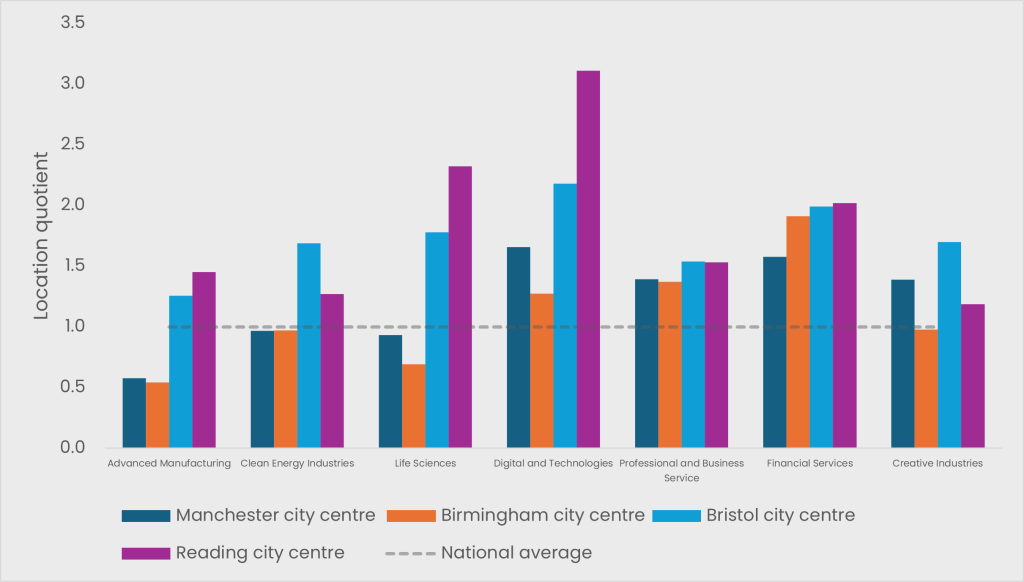
The second is that they are too small. And this limits both the amount of prosperity they generate for their surrounding region and their role in the national economy. Birmingham city centre is home to 7 IS-8 firms per 10,000 of the working age population of the city region, while for Manchester the figure is 14. In contrast, this figure is 23 in Bristol city centre.
This does not mean that other parts of the city region could do better through the help of policy. But it does mean that the expectation of what can be achieved needs to be different, which in turn shapes the relative weight that policy gives to these areas compared to the city centre. And it is clear that Birmingham city centre in particular is not making the contribution to the Government’s Industrial Strategy that the country needs it to.
Measuring the IS-8 is the first step to helping places reach their potential
There is large variation across places in how much of the IS-8 they have in their area. This variation isn’t inherently a problem – we should expect different outcomes in different areas because of the inherent they do or don’t offer to different types of industries. The question for places is what the best possible version of themselves looks like, and how far away from this they currently are. Our data is the first step to allowing them to do that.
What to find out more about our mapping of the Industrial Strategy IS-8 sectors? Download our Open Sourcing the Industrial Strategy report.
For everything else, make sure you sign up for a free trial of our real-time platform and can see our company and IS-8 data in action for yourself.
A note on our methodology:
This article uses ITL2 regions as its core geography, which includes areas such as Greater Manchester, West Yorkshire and Cumbria. The exception is London, where we group the 5 ITLs that define London – which is a single city – into one. It also excludes Defence from the IS8- definition. The Data City is currently working with ADS to create a definition of this sector.